Q2.1 - Lower Huanta - Bajo Huanta
Site Q2.1: Lower Huanta (Bajo Huanta) - Boca Huanta
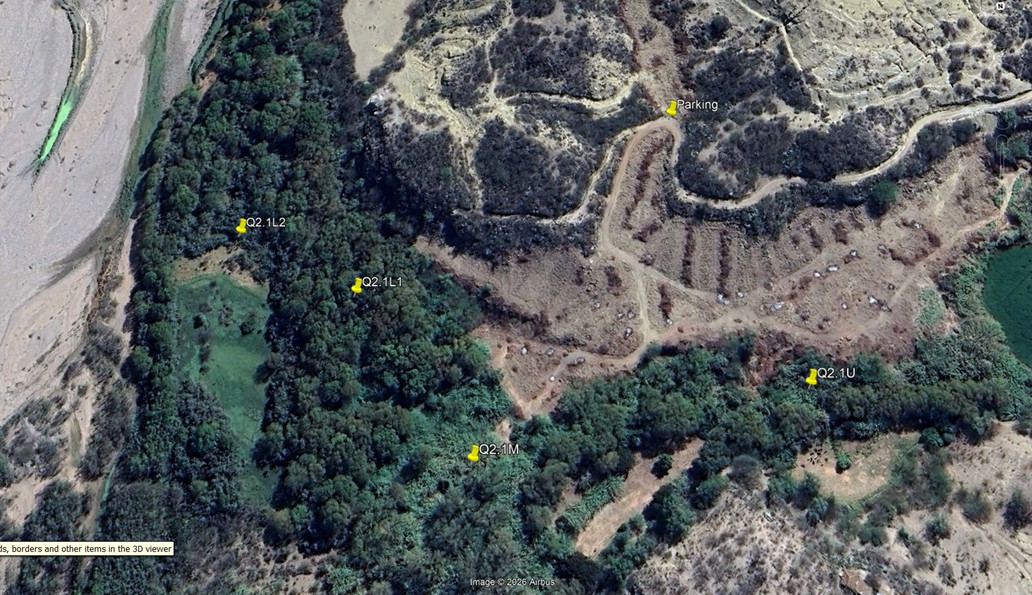 Aerial view of study site / Vista aérea del lugar del estudio (March 2023) (John Forrest)
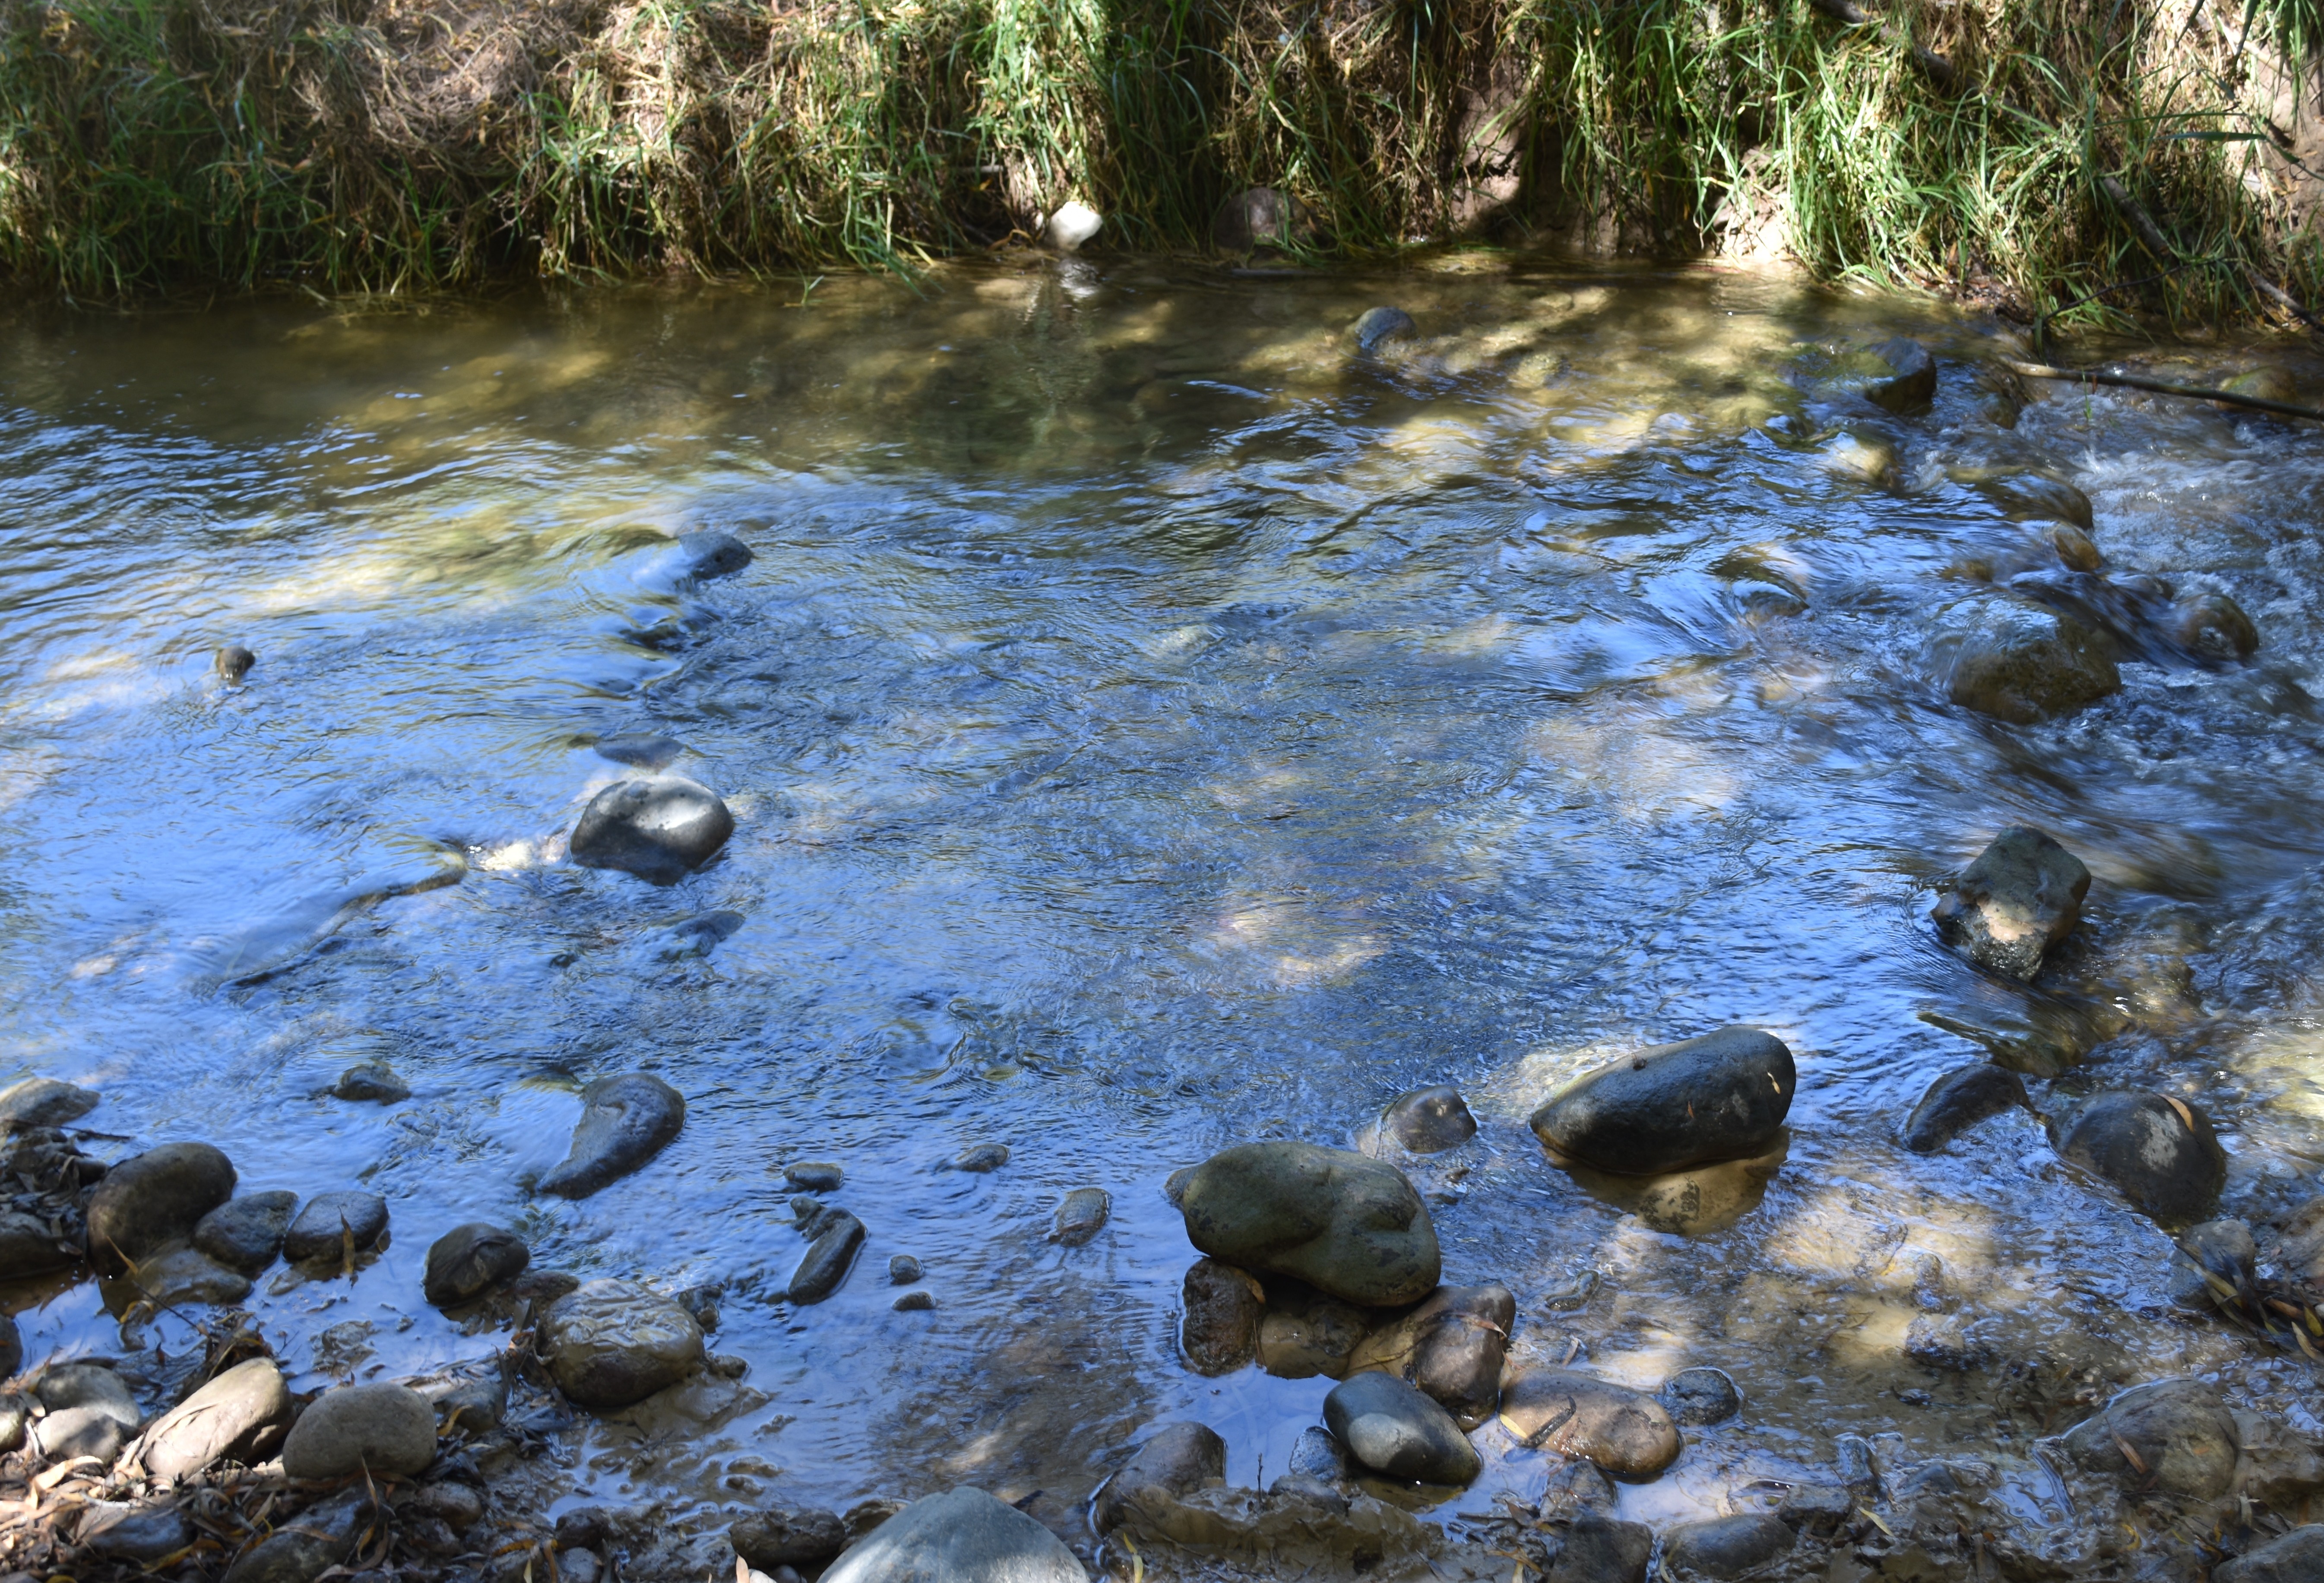
Site Q2.1U (visited February and June 2025, and March 2026 / visitado en febrero y junio 2025, y marzo 2026)
GPS: S12°961960, W74°294750. Elevation: 2305 m asl.
This is the preferred location in the wet season / Este es el lugar ideal durante la temporada de lluvias.
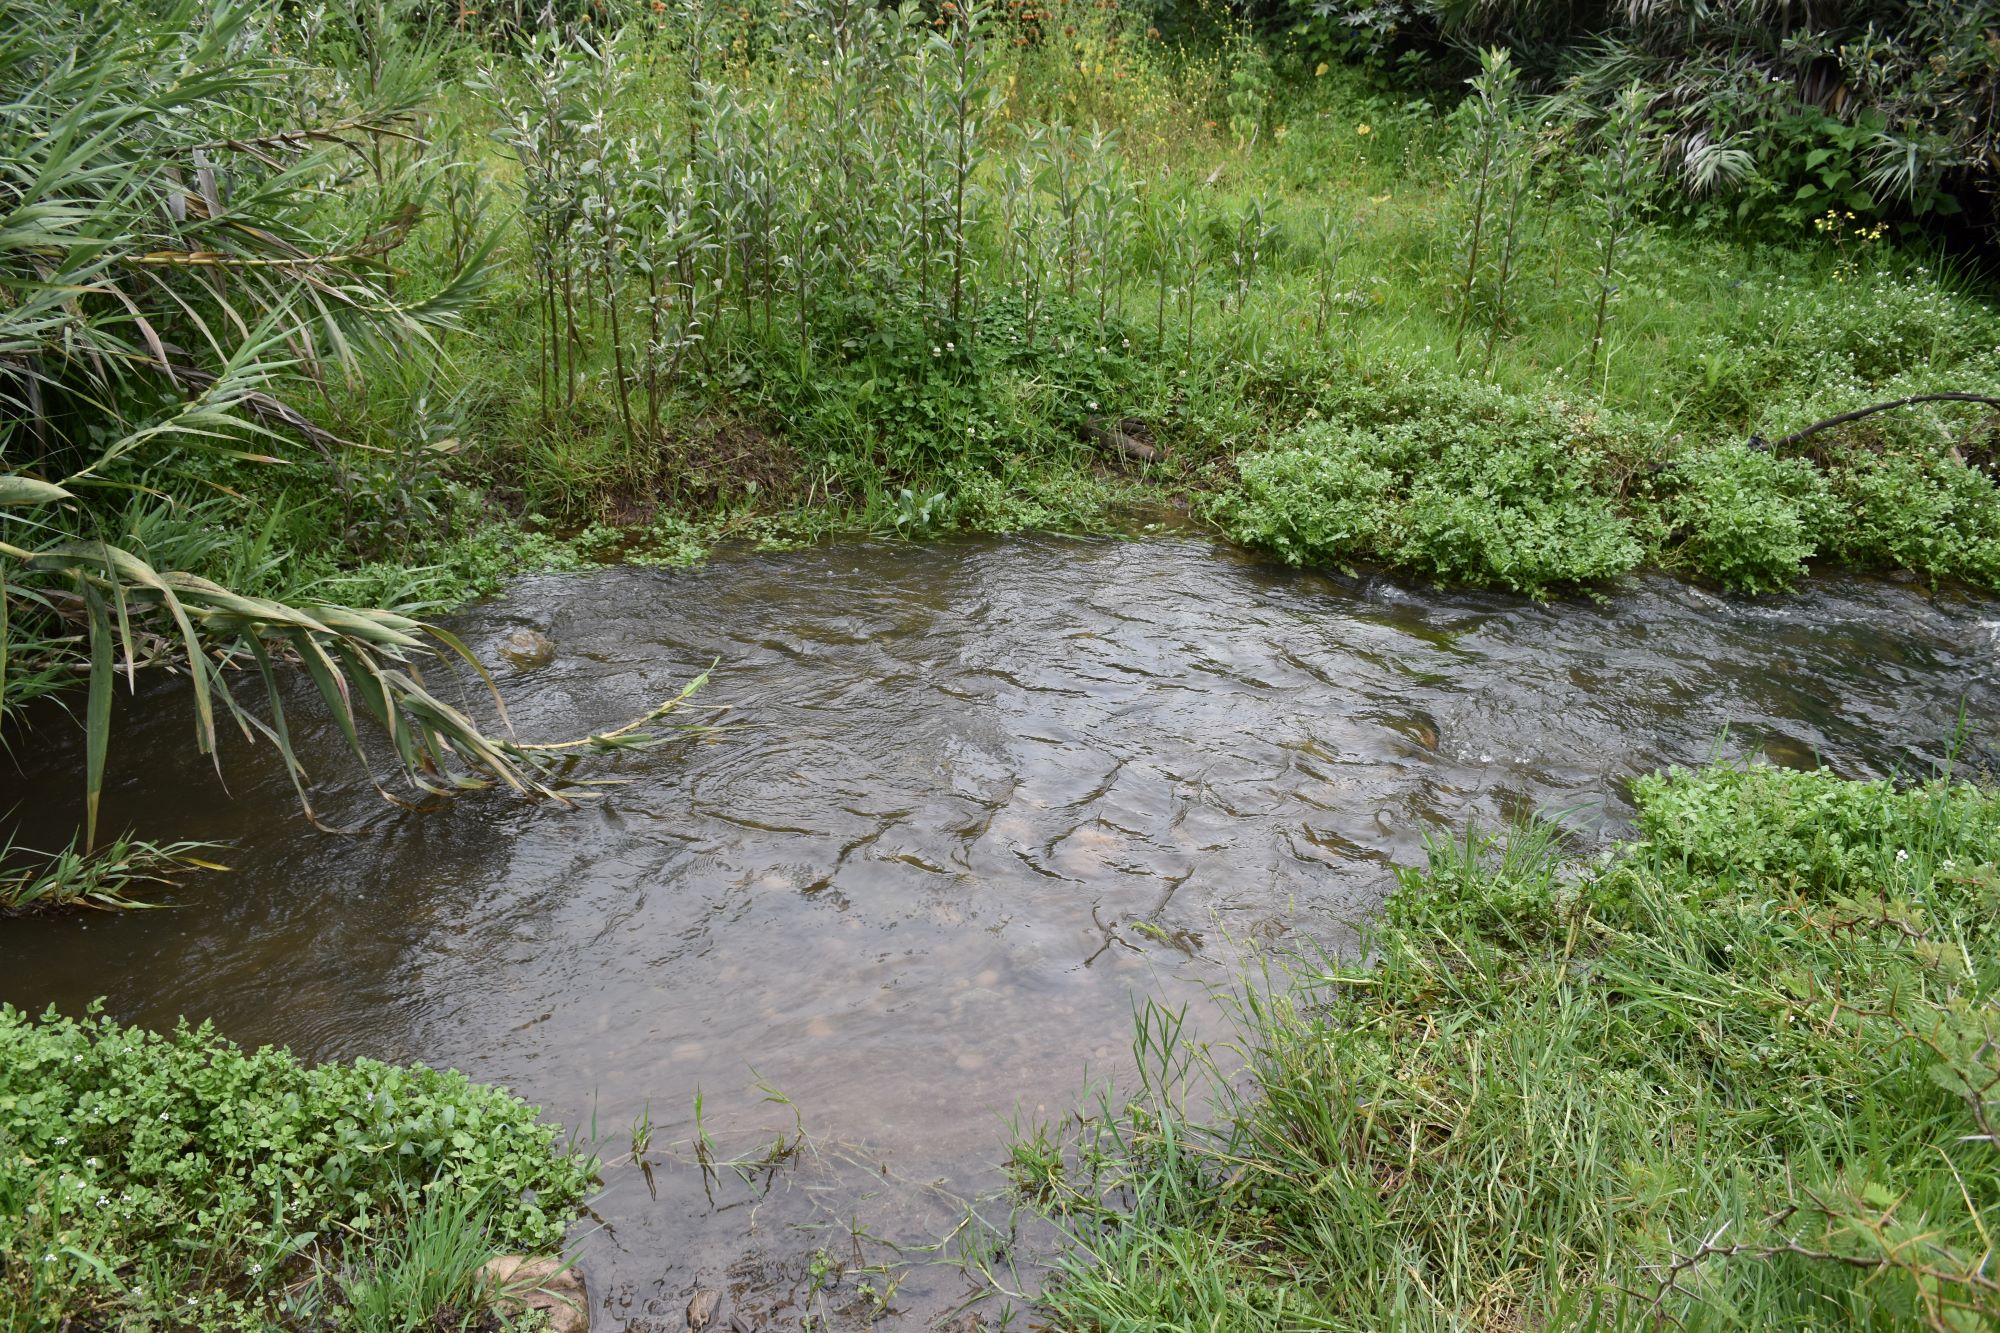
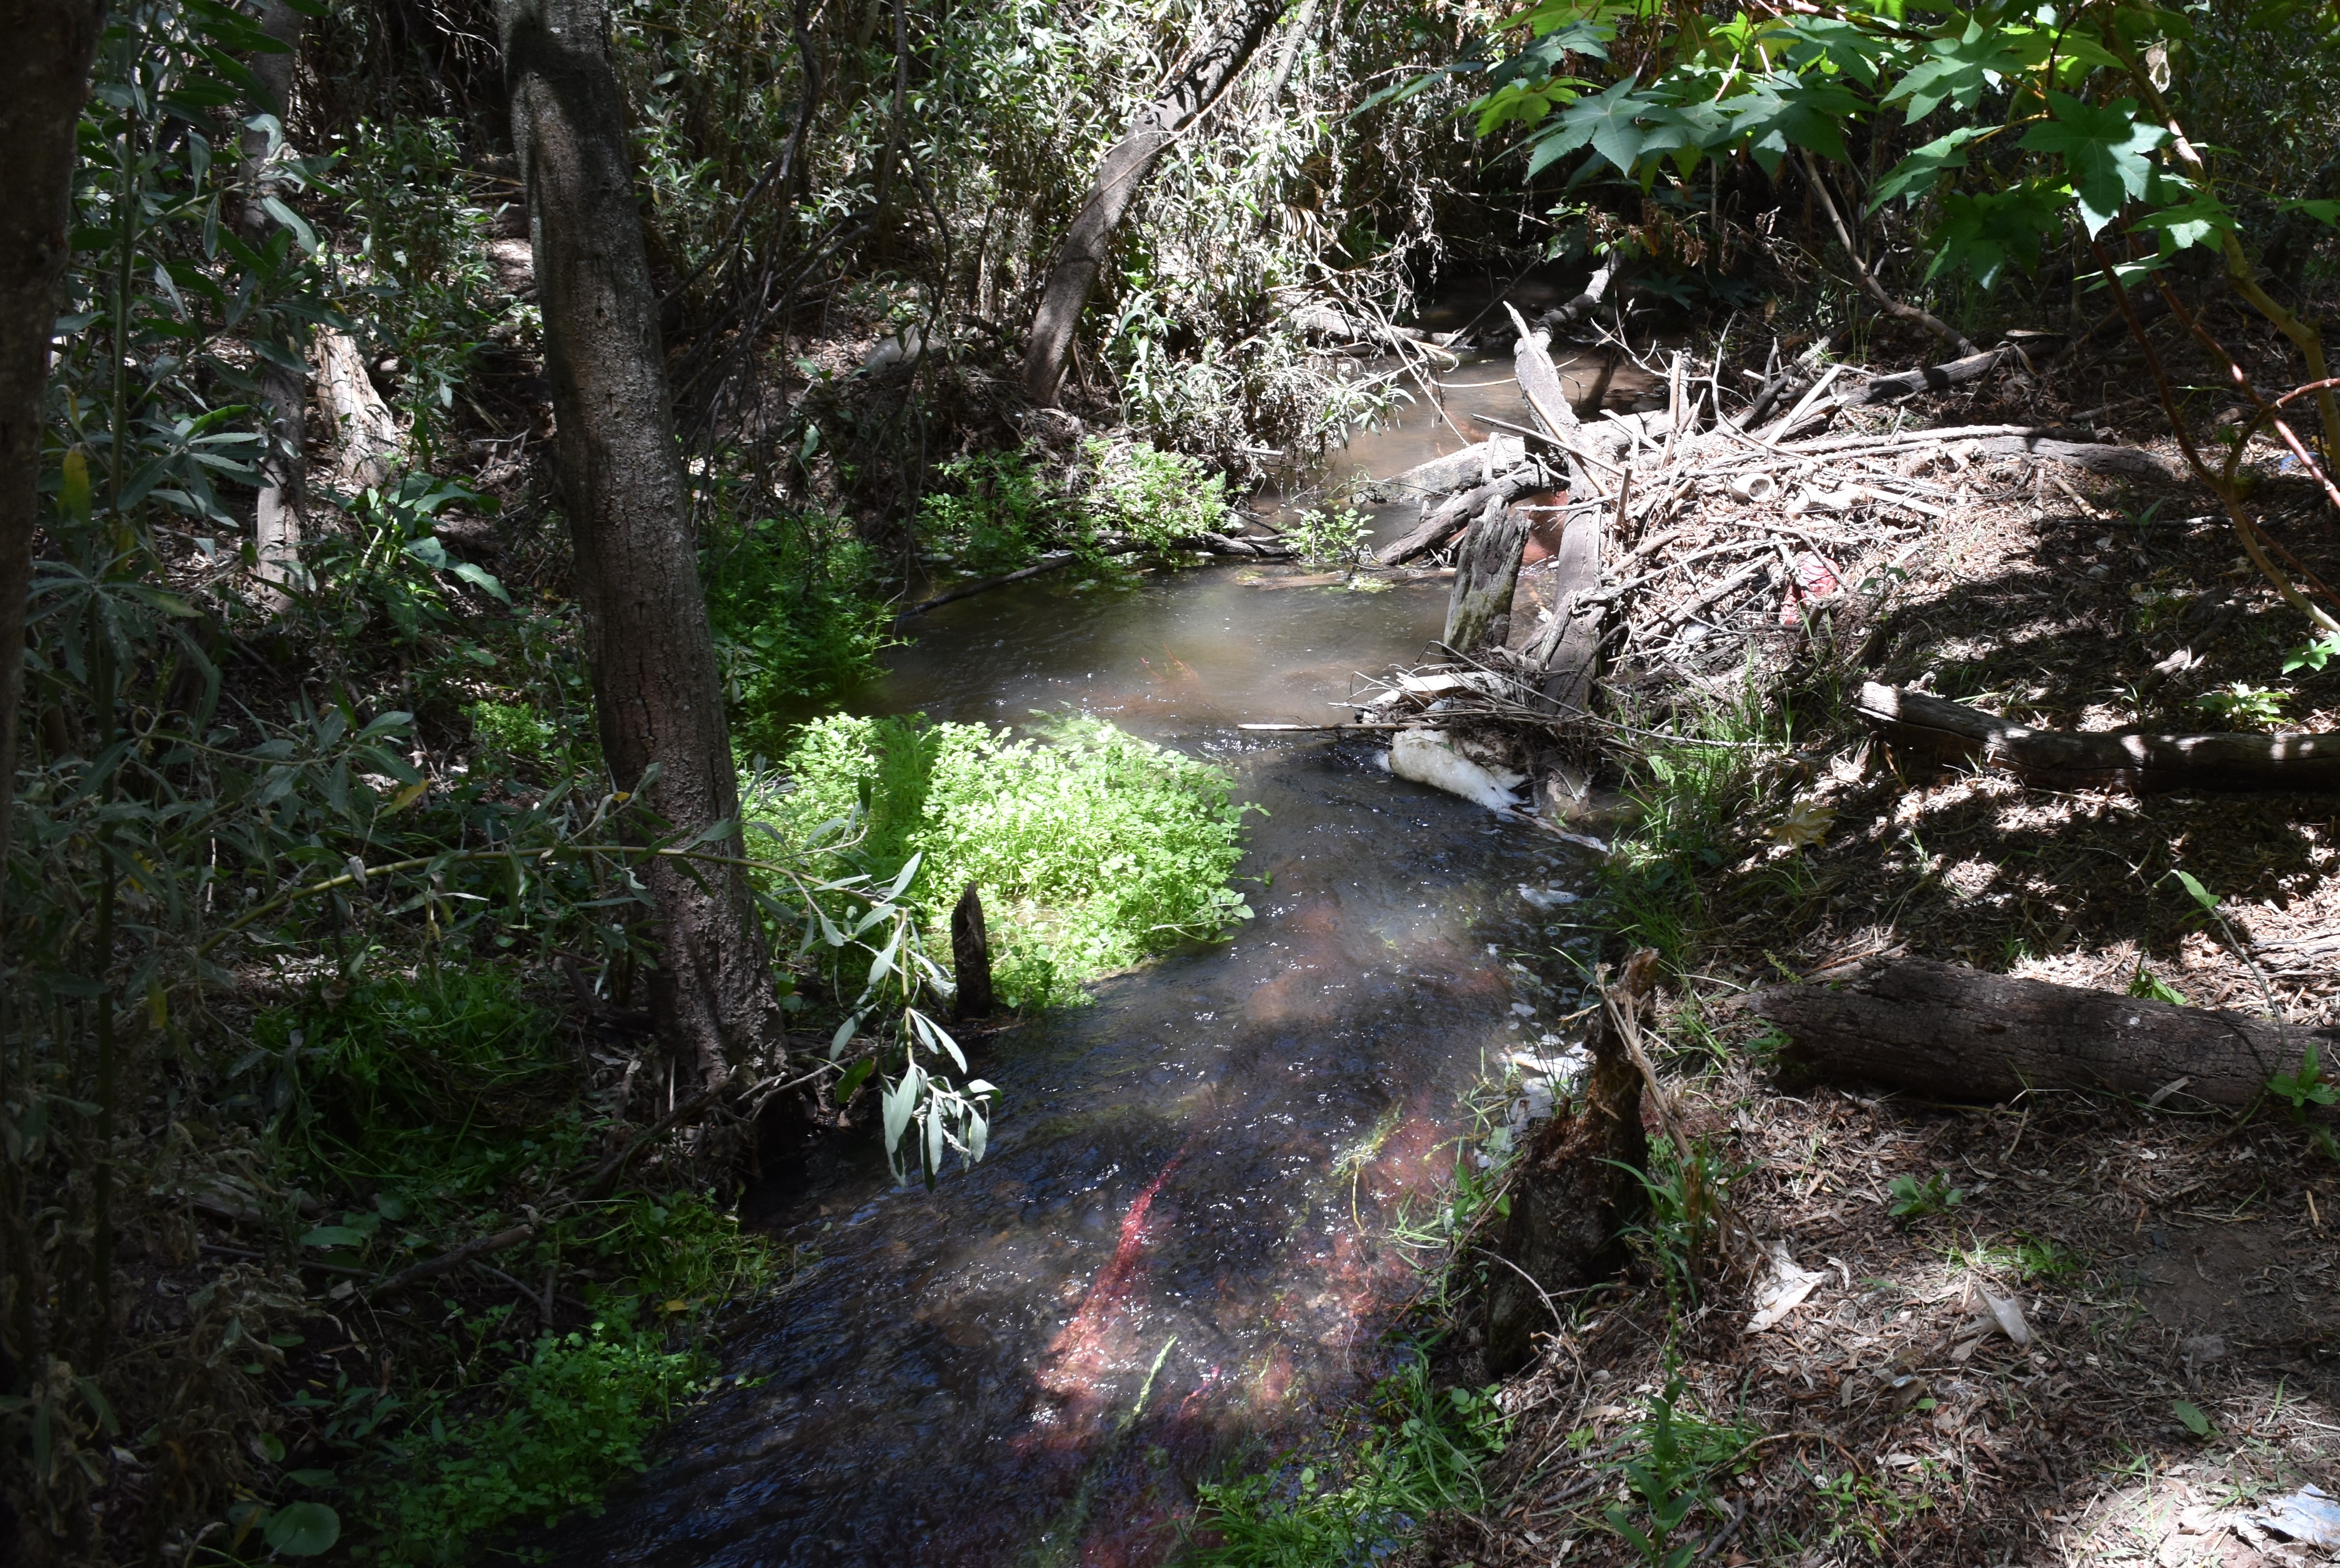
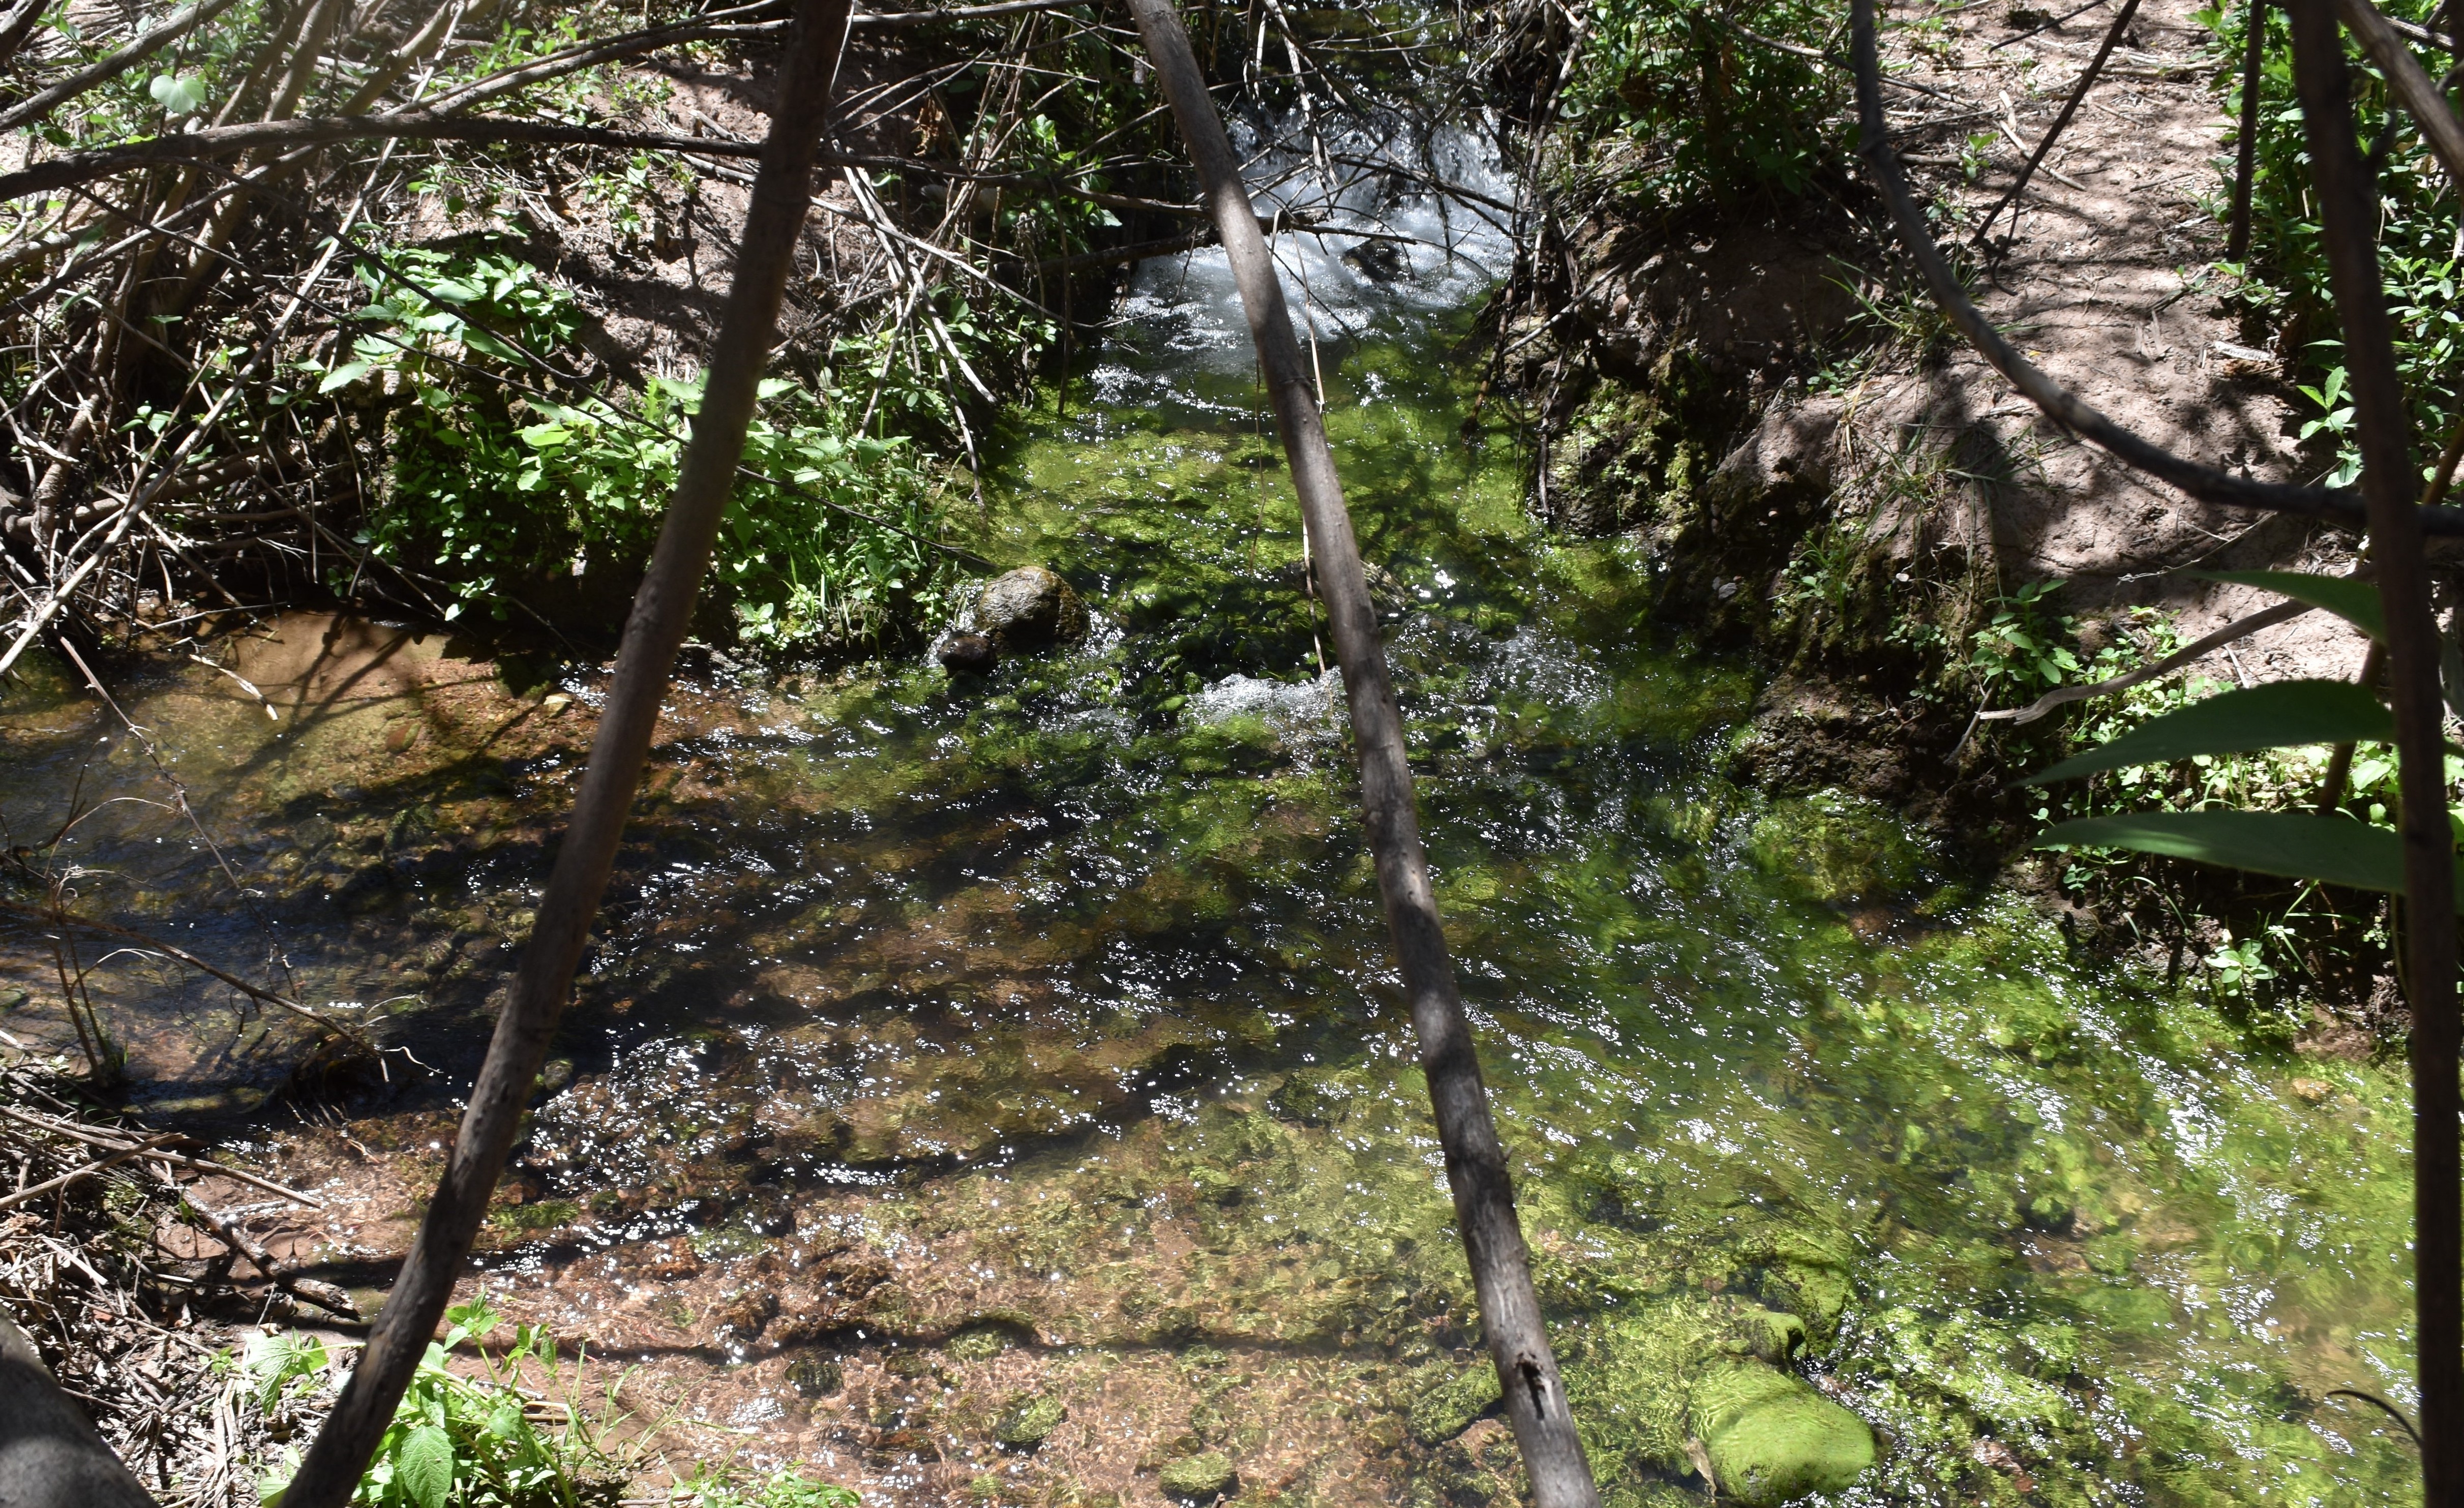
 The study site / El lugar del estudio (November 2023) (John Forrest)
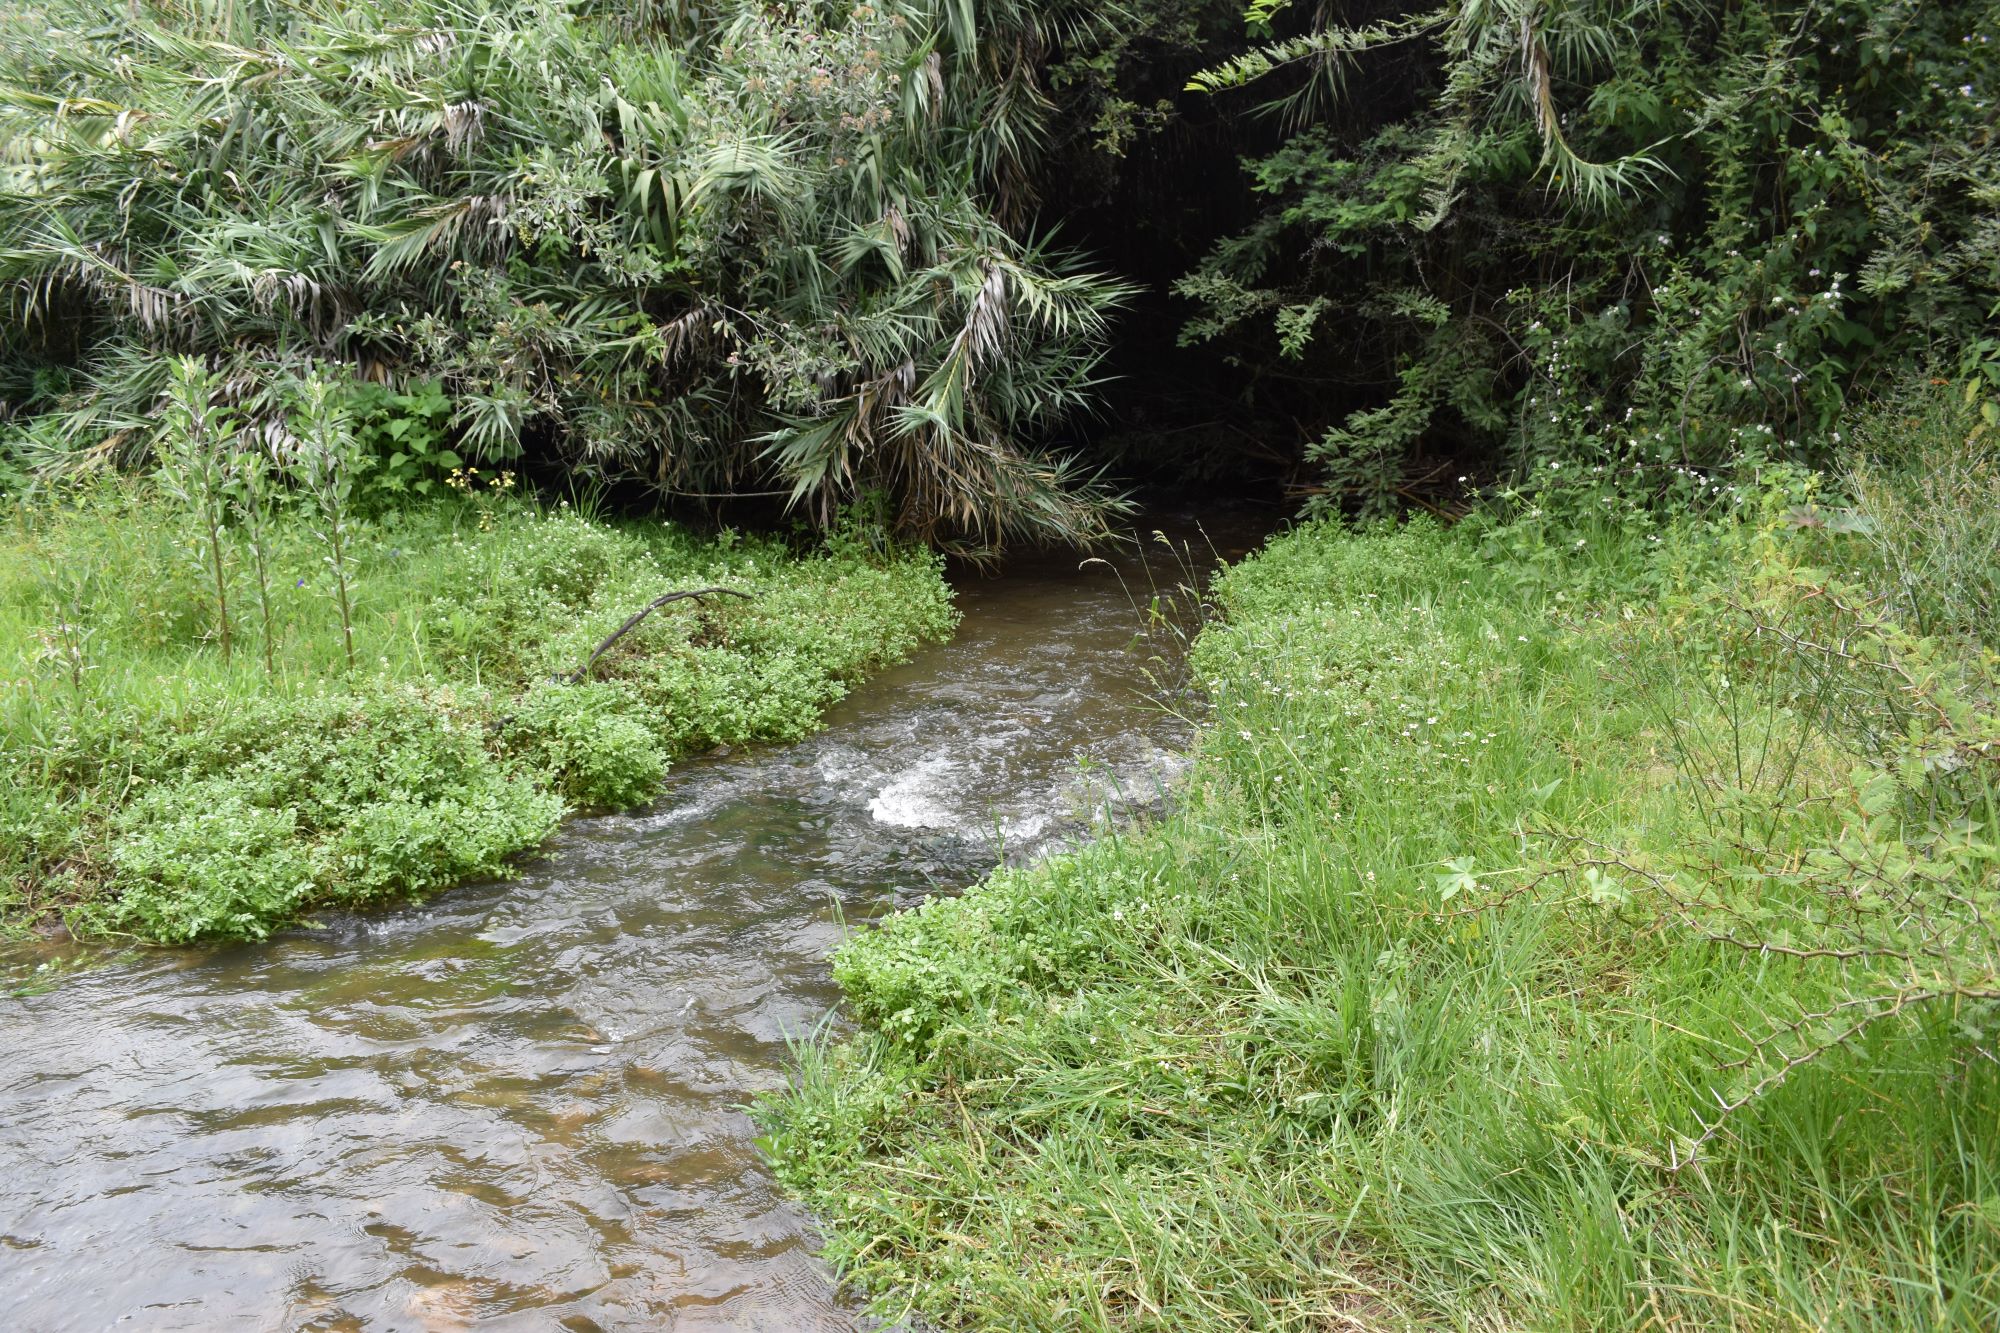
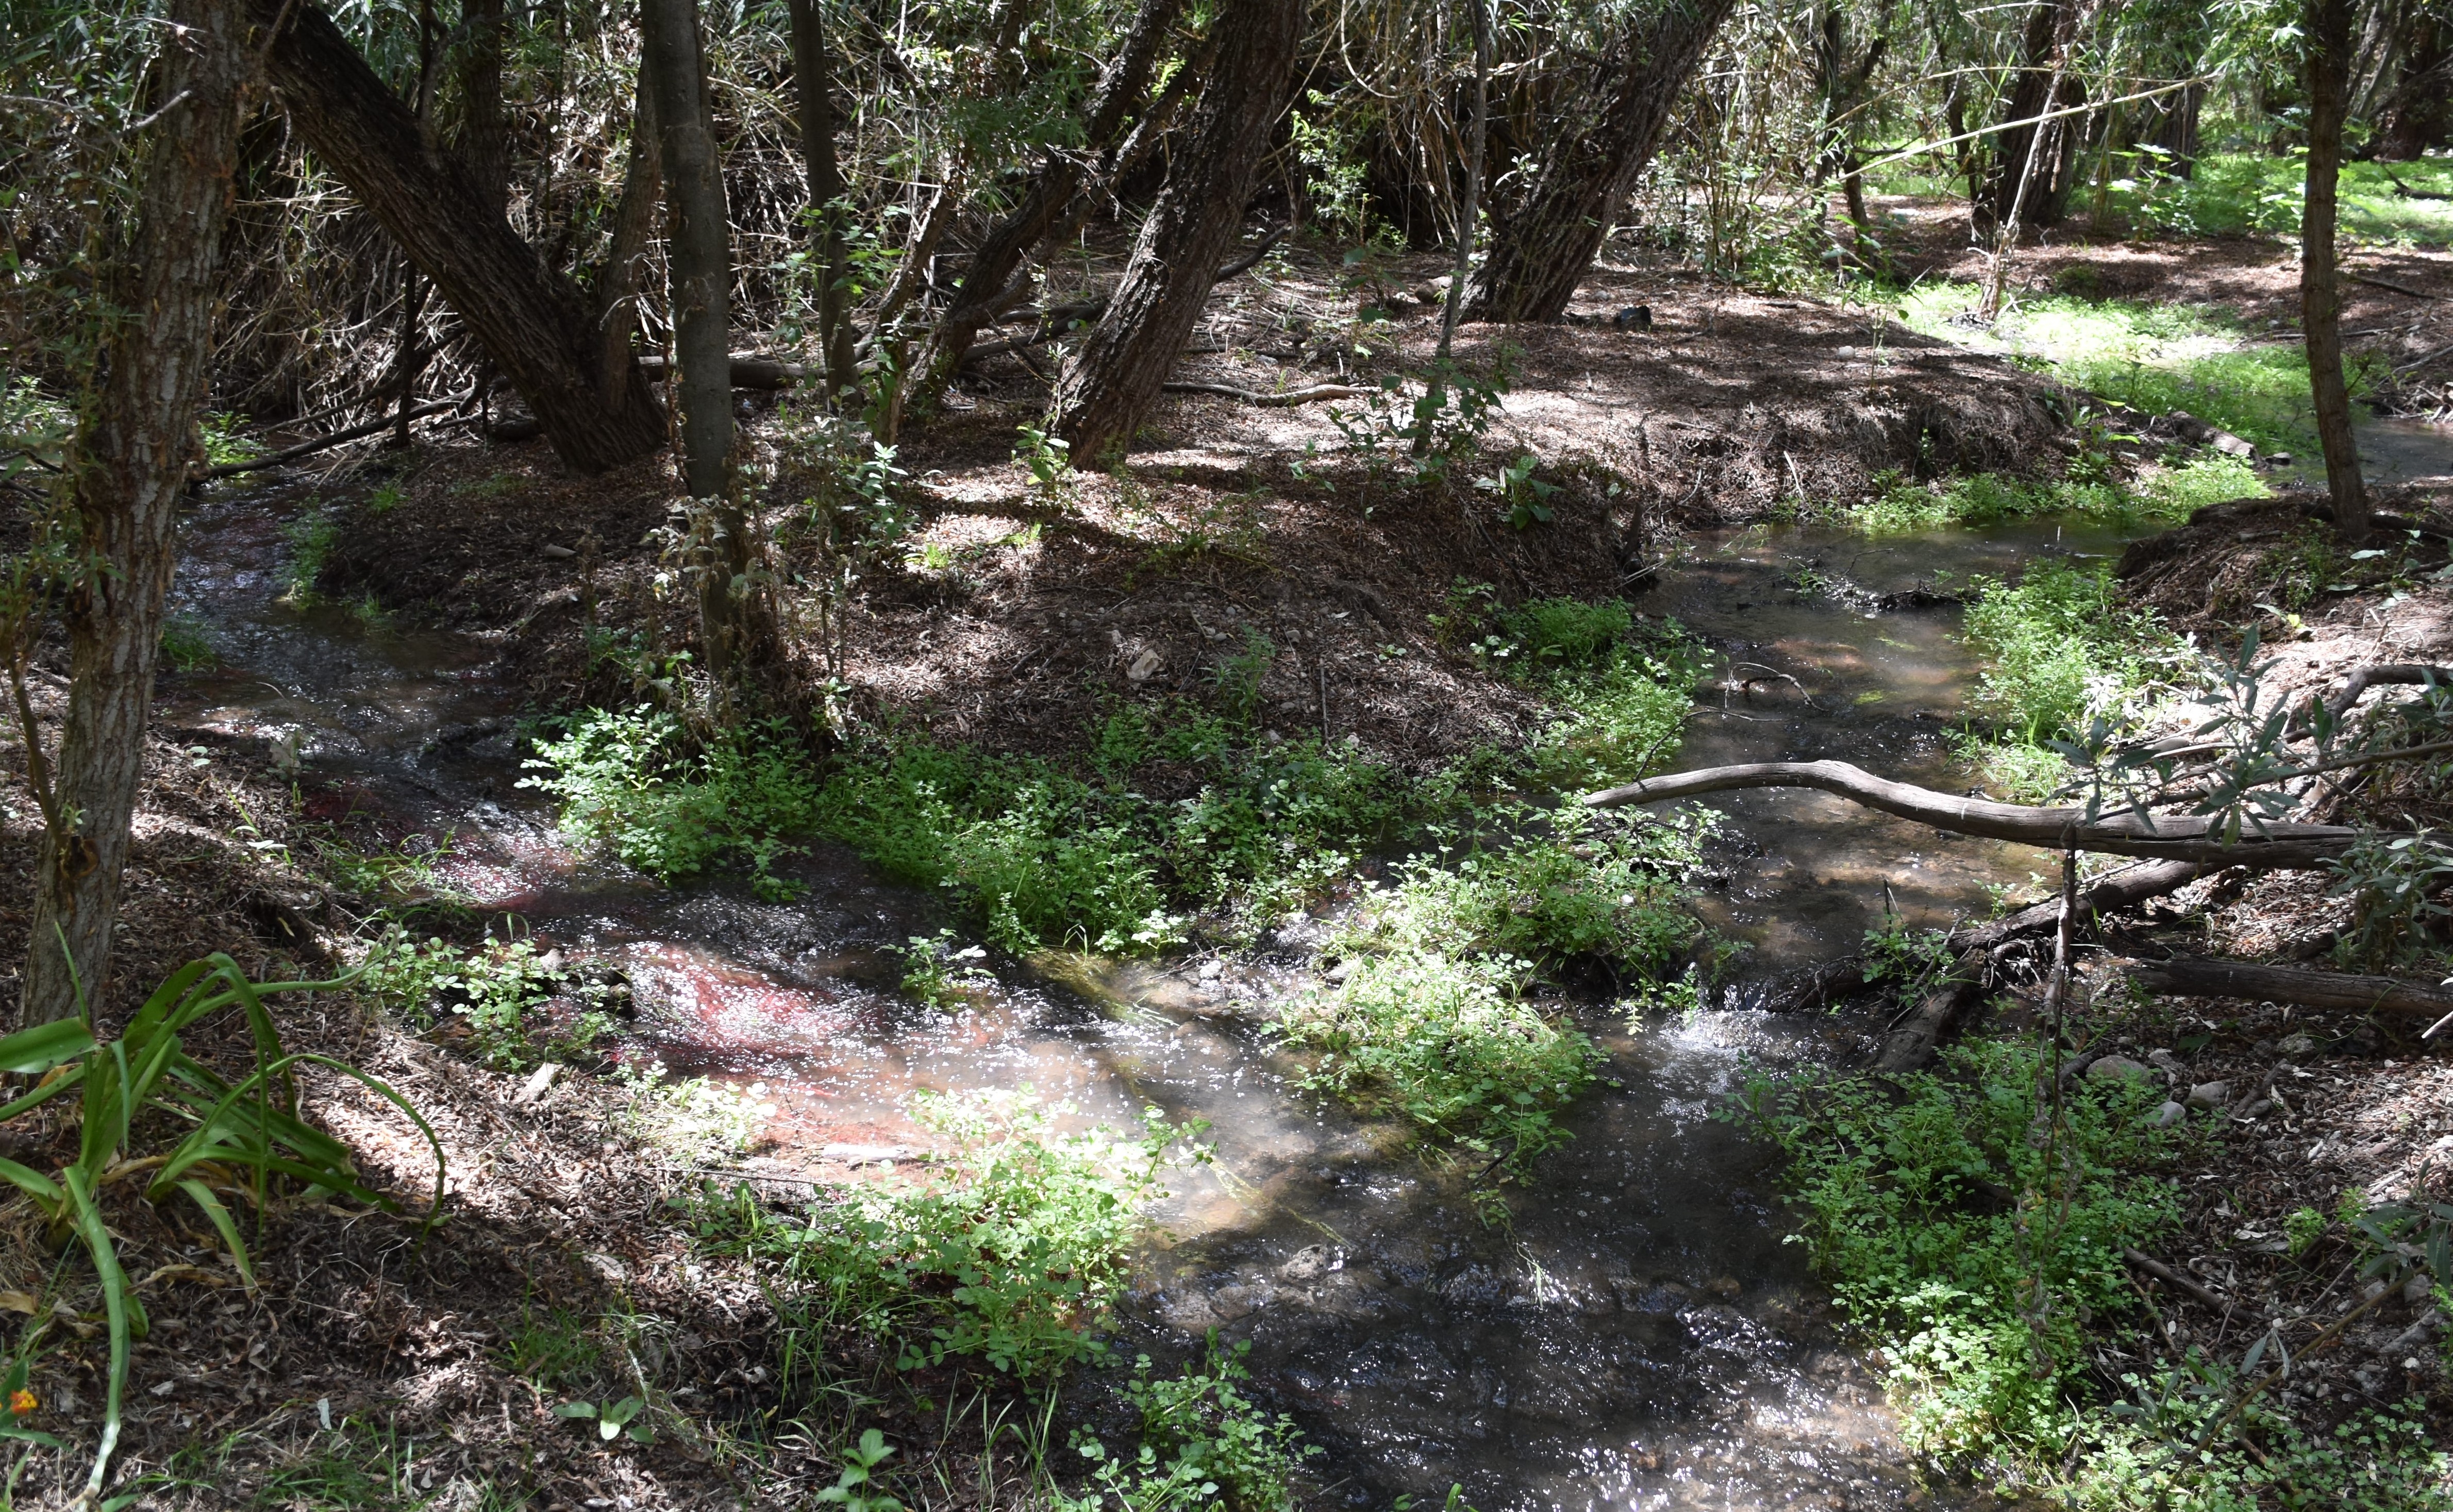
 View downstream from the study site / Visita rio abajo del lugar del estudio (November 2023) (John Forrest)
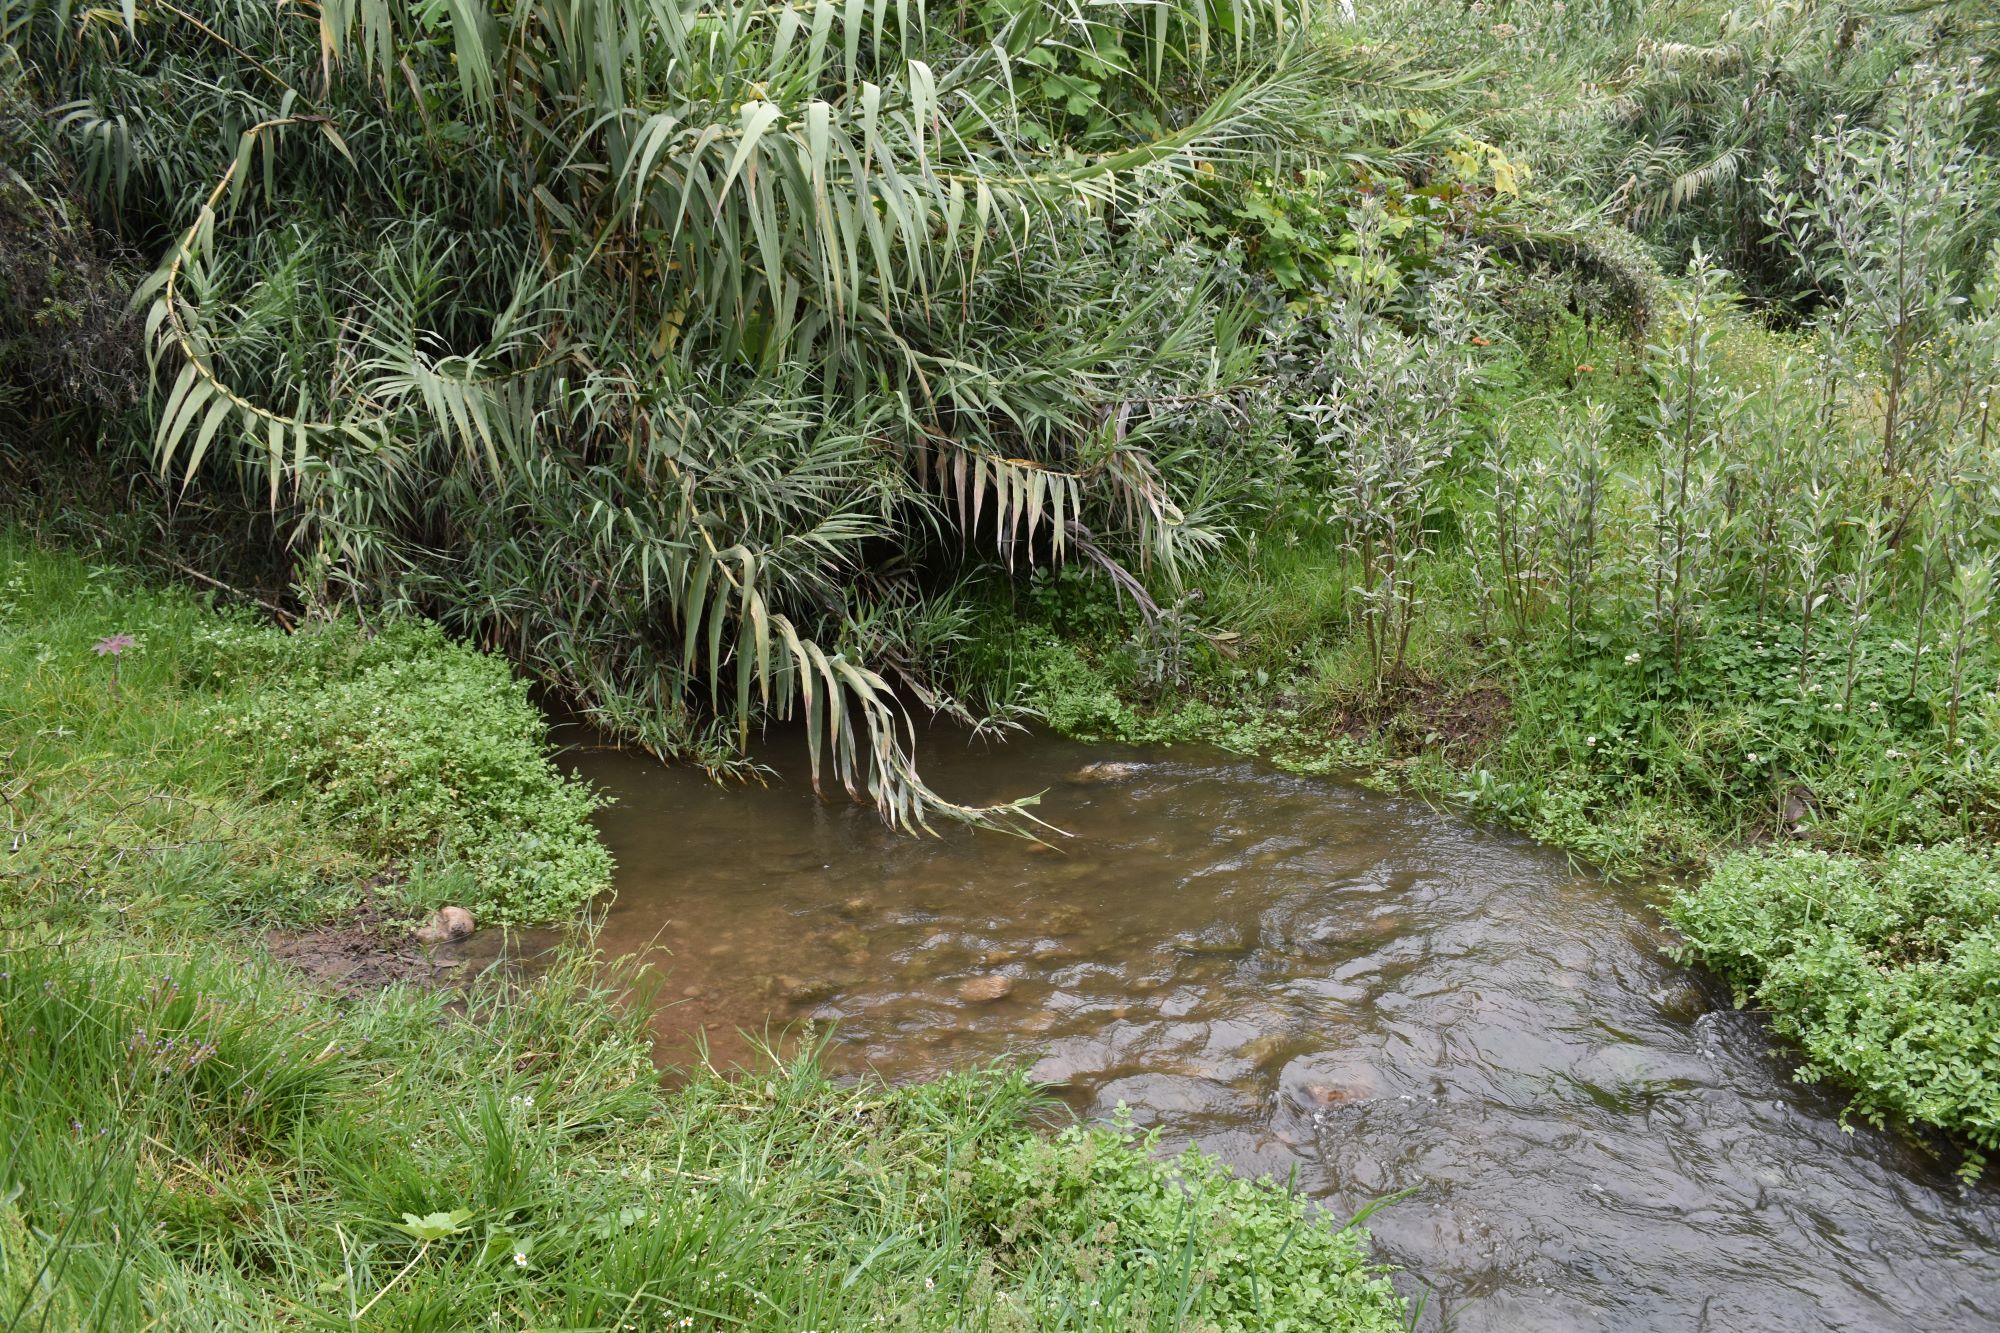
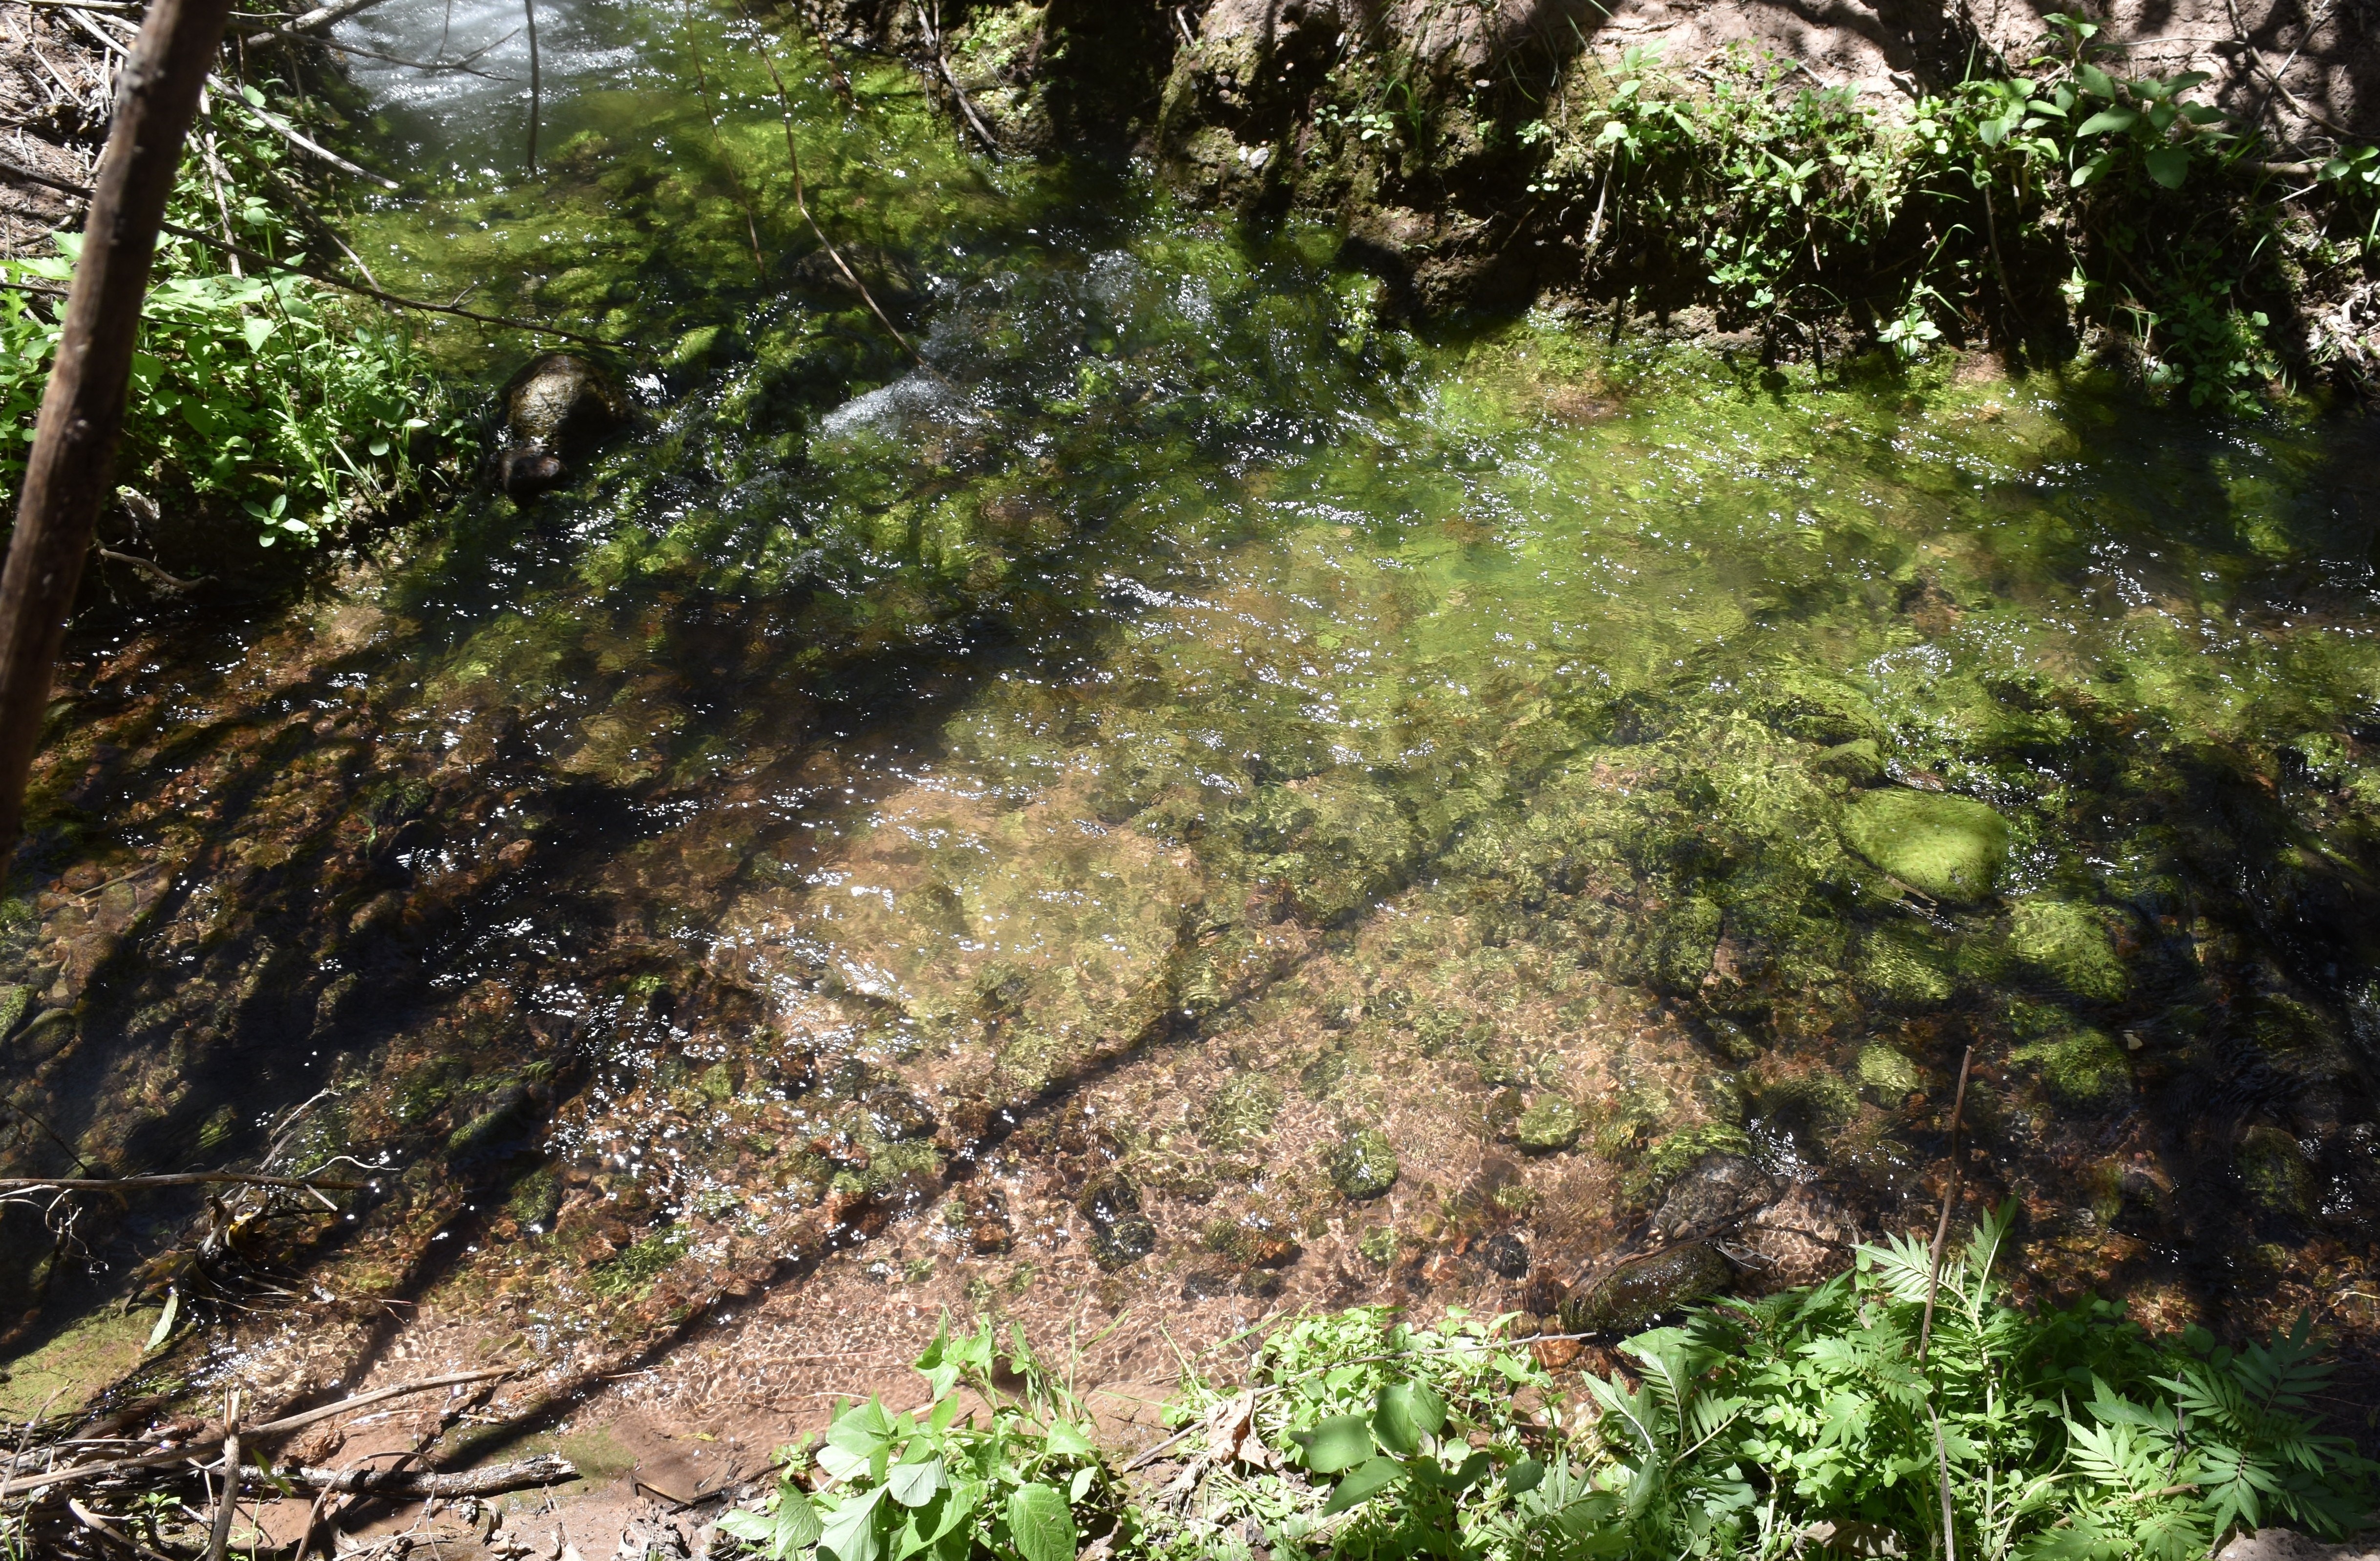
 View upstream from the study site / Vista rio arriba desde el lugar del estudio (November 2023) (John Forrest)
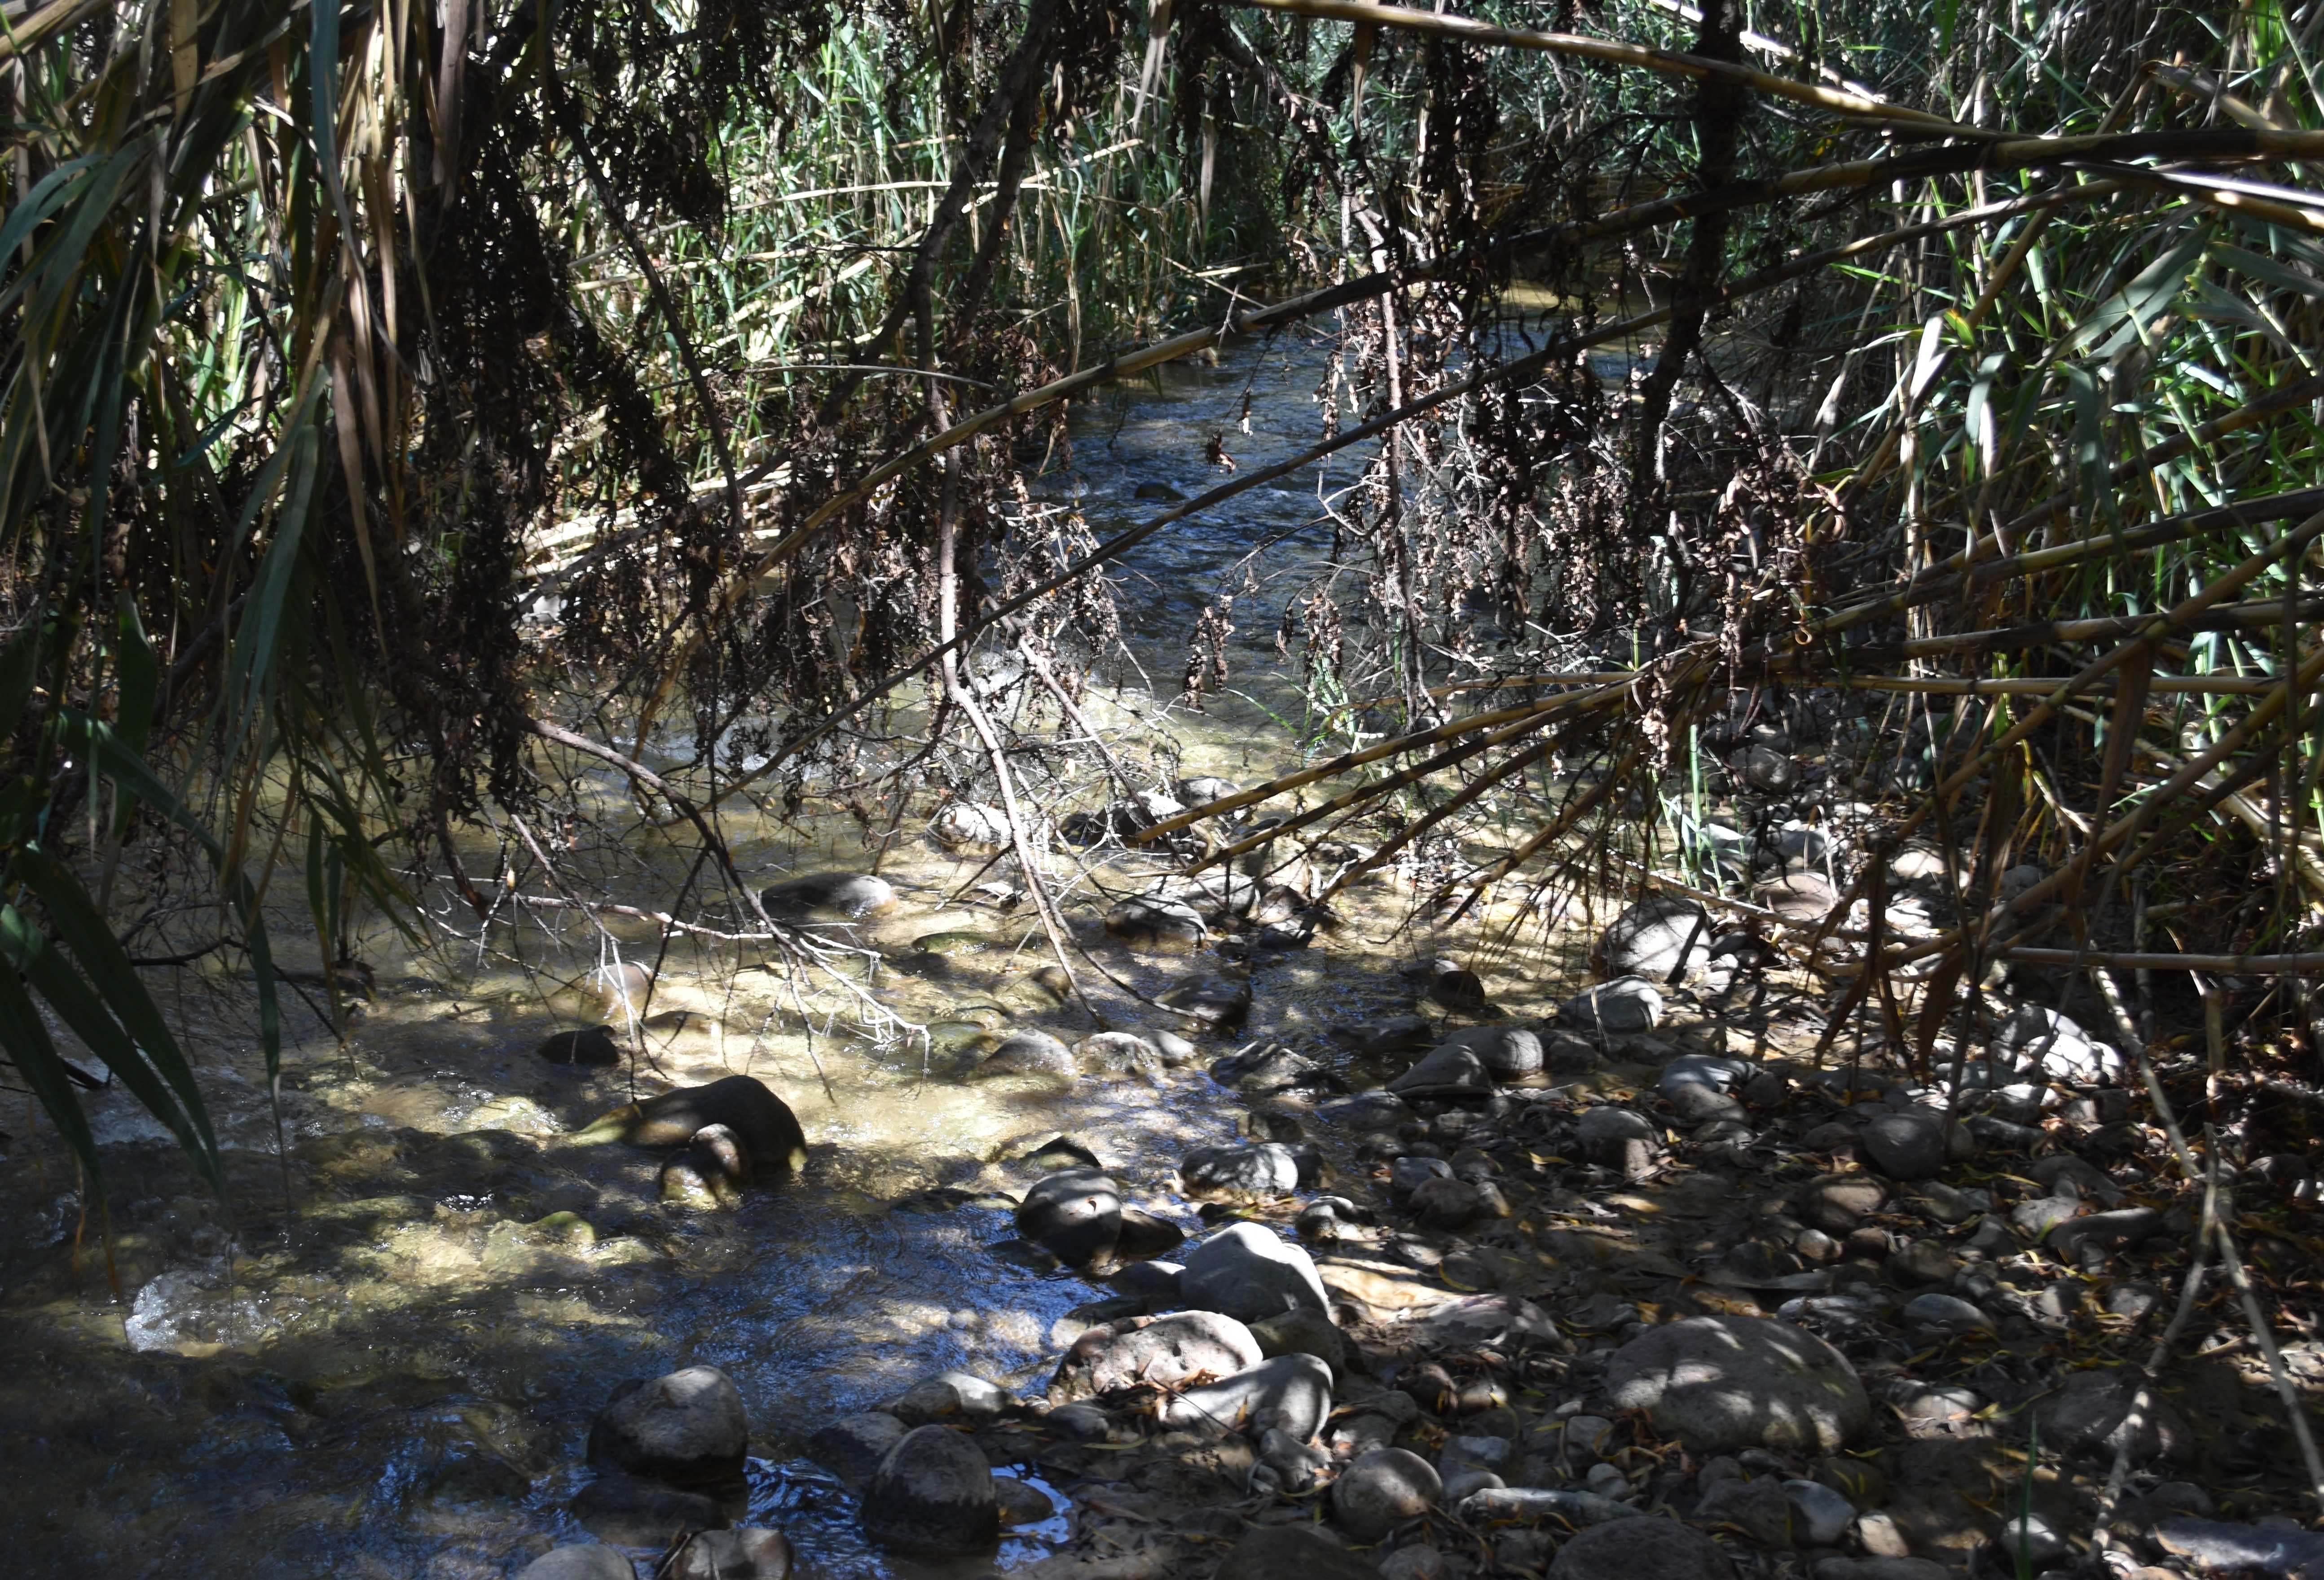
Site Q2.1M (visited March & June 2023 / visitado en marzo y junio 2023)
GPS: S12°962055, W74°296105. Elevation: 2300 m asl.
Water only flows here in flood conditions now / Ahora solo fluye agua aquí en condiciones de inundación.
 The study site / El lugar del estudio (March 2023) (John Forrest)
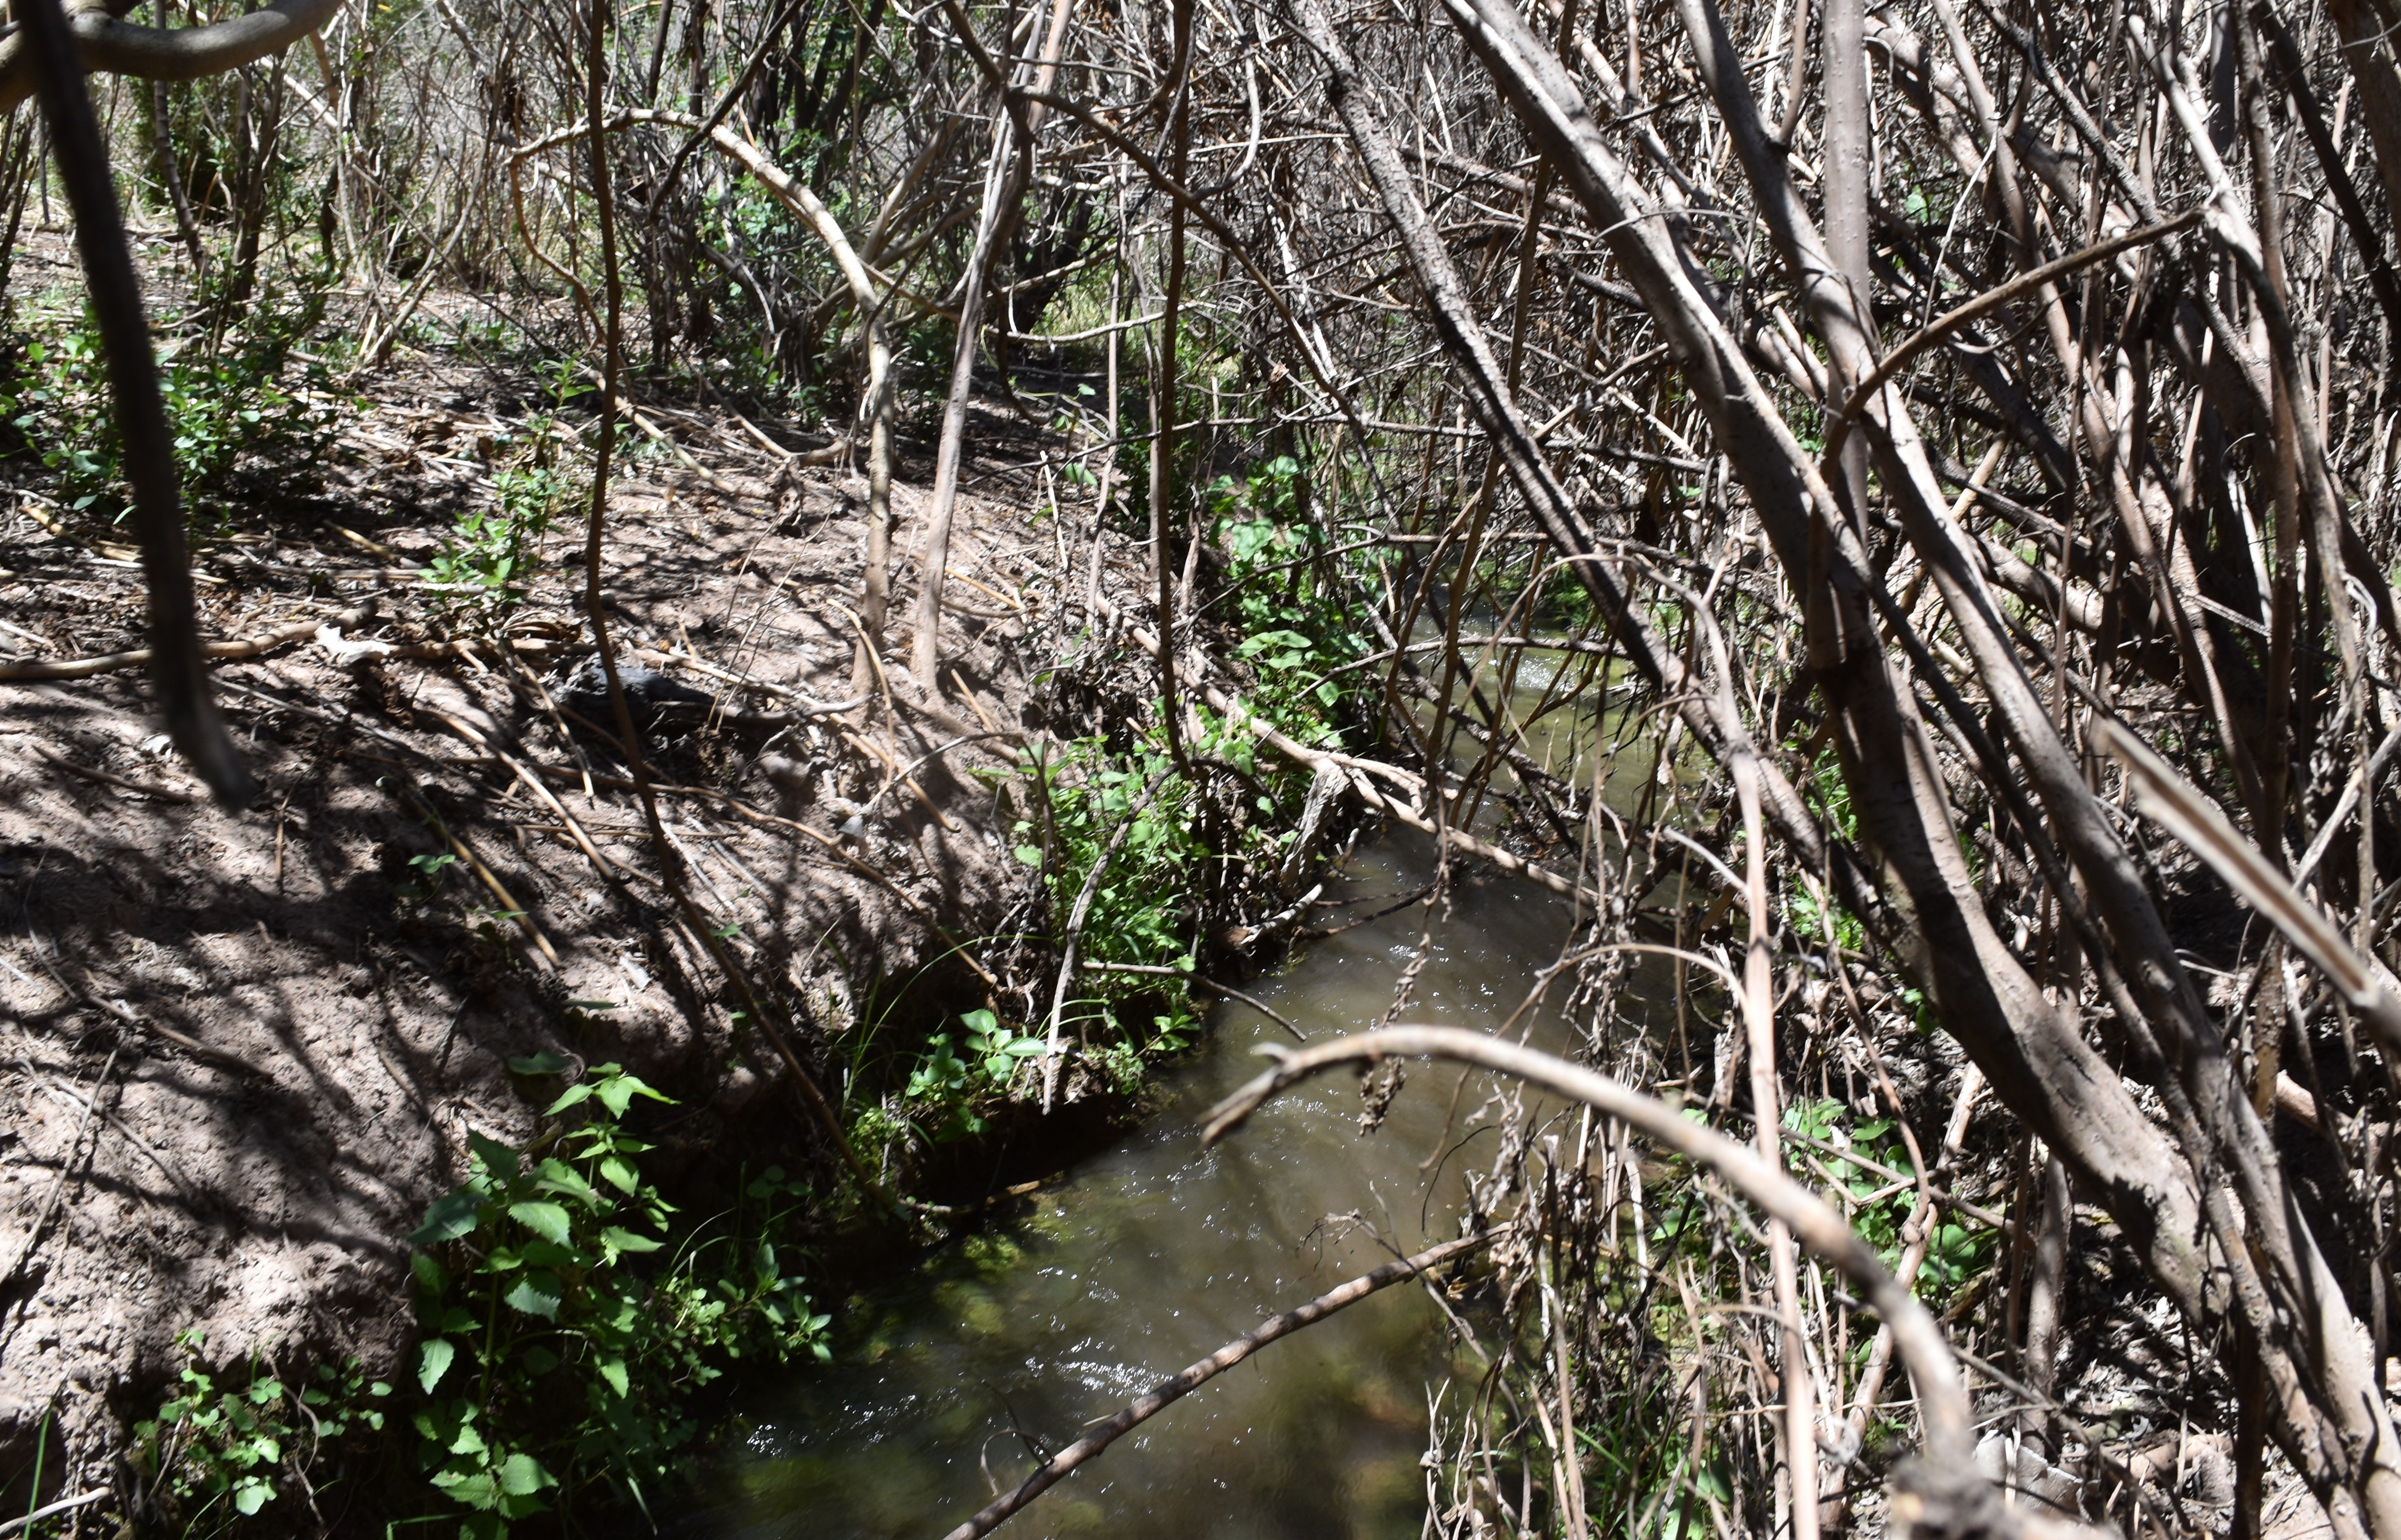
 View downstream from the study site / Visita rio abajo del lugar del estudio (March 2023) (John Forrest)
 View upstream from the study site / Vista rio arriba desde el lugar del estudio (March 2023) (John Forrest)
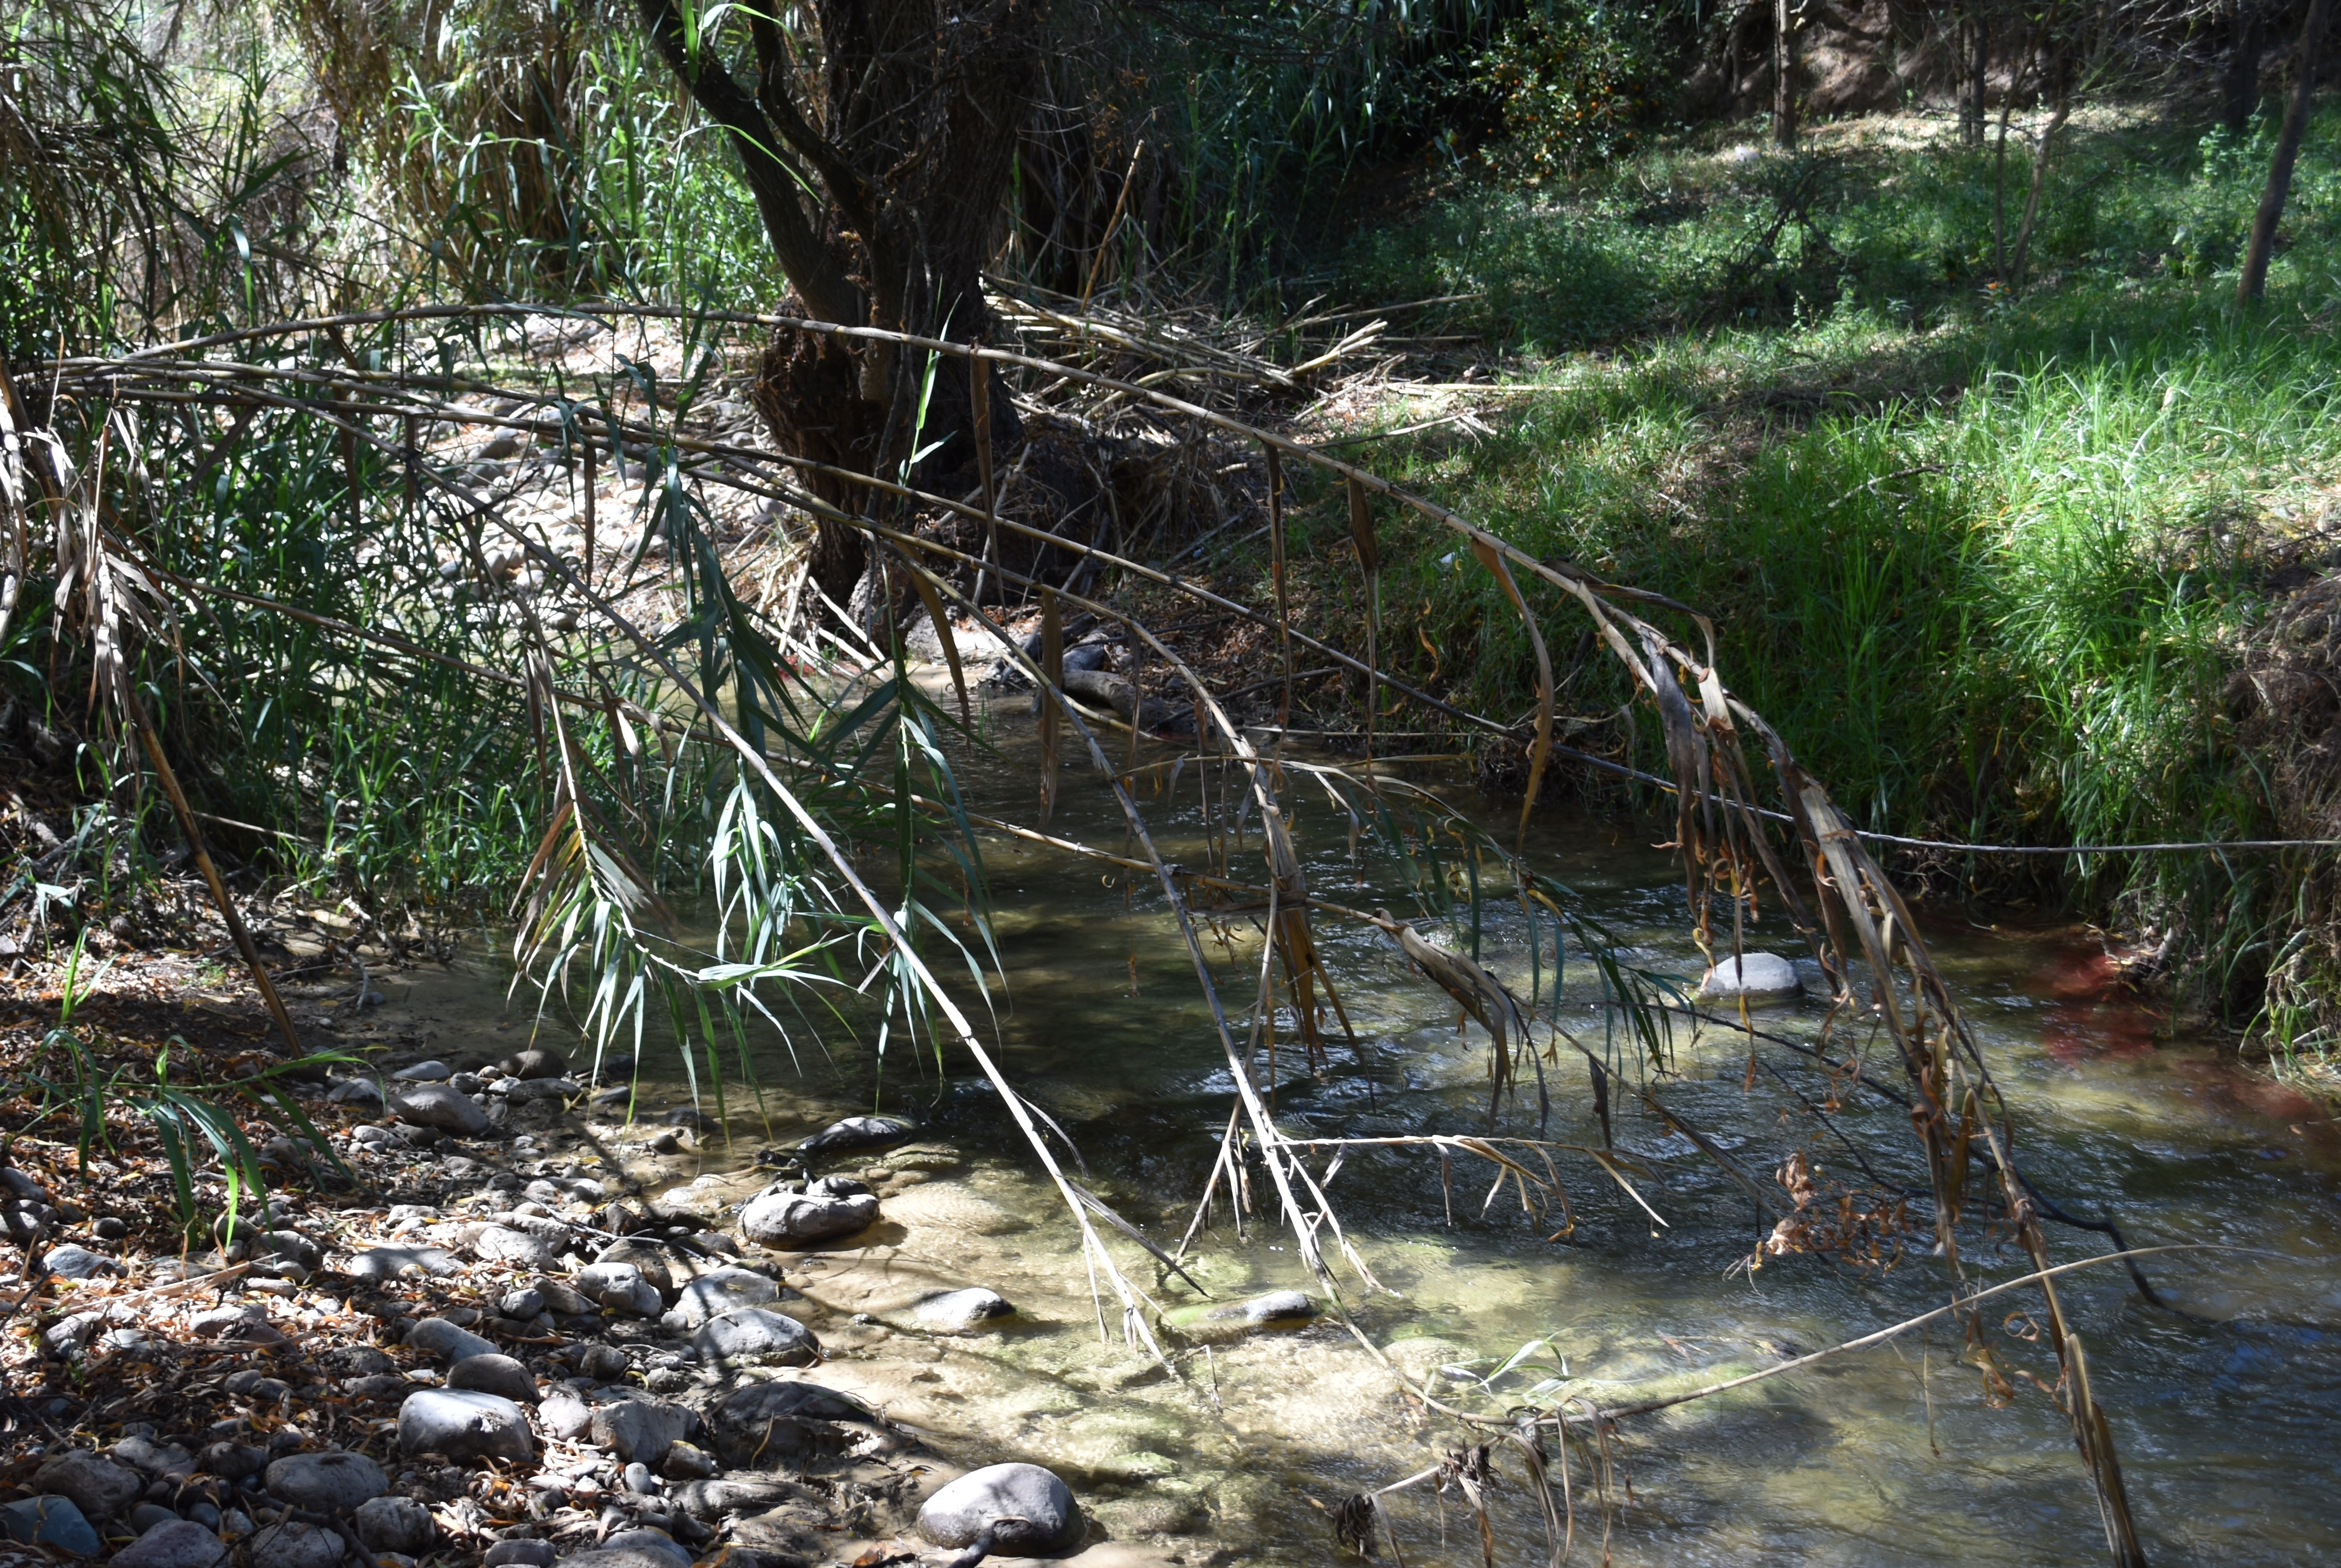
Site Q2.1L1 (visited November 2023 and all visits in 2024 / visitado en noviembre 2023 y todas las visitas en 2024)
GPS: S12°966633, W74°250332. Elevation: 2298 m asl.
Water only flows here in flood conditions now / Ahora solo fluye agua aquí en condiciones de inundación.
 The study site / El lugar del estudio (November 2023) (John Forrest)
 View downstream from the study site / Visita rio abajo del lugar del estudio (November 2023) (John Forrest)
 View upstream from the study site / Vista rio arriba desde el lugar del estudio (November 2023) (John Forrest)
Site Q2.1L2 (visited November 2025)
GPS: S12°961050, W74°297090. Elevation: 2293 m asl.
This is the preferred site at this location in the dry season / Este es el lugar preferido en esta zona durante la estación seca.
 The study site / El lugar del estudio (November 2023) (John Forrest)
 View downstream from the study site / Visita rio abajo del lugar del estudio (November 2023) (John Forrest)
 View upstream from the study site - below the point where two channels meet/ Vista rio arriba desde el lugar del estudio - debajo del punto donde se unen dos canales. (November 2023) (John Forrest)
Site descriptions
Q2.1 is located in a small valley with a narrow flood-plain cutting through the foothills lining the eastern flank of the Cachi valley, below Huanta. The river Huanta is known as the river Perascucho at this point.
The original study site (Q2.1M) is situated about 100 metres above the confluence of the river Huanta with the river Cachi. This site is now overgrown and inaccessible.
The next site used (Q2.1L1) is located about 50 metres downstream in the wooded area where the river divides into many channels in the wet season.
It now appears that Q2.1L1 and Q2.1M were overflow channels and not the main channel. Consequently, a point about 50 metres further upstream from Q1.2M was identified (Q2.1U) which fully represents the discharge at this site in the wet season and a point further downstream has been identified (Q2.1L2) which fully represents the discharge at this site in the dry season.
Access to all sites is along the right bank of the river down a rough track through and beyond the Hacienda San Jose de Toyas. The road ends about 500m beyond the hacienda amongst scrubby vegetation though post-June 2023 much of the vegetation on the right bank was cleared and converted to farmland. A path leads from the track down across the fields to the left to Q2.1U and to the right down to a gate in to the woodland through which the river runs to access Q2.1L2.
Descripciónes de los sitios
Q2.1 se encuentra en un pequeño valle con una estrecha llanura de inundación que corta a través de las estribaciones que bordean el flanco oriental del valle de Cachi, por debajo de Huanta. El río Huanta se conoce como el Río Perascucho en este punto.
El sitio original del estudio (Q2.1M) está situado a unos 200 metros por encima de la confluencia del río Huanta con el río Cachi. Este sitio está ahora cubierto de maleza y es inaccesible.
El siguiente sitio utilizado (Q2.1L1) se encuentra a unos 50 metros río abajo, en la zona boscosa donde el río se divide en muchos canales durante la temporada húmeda.
Ahora parece que Q2.1L1 y Q2.1M eran canales de desbordamiento y no el canal principal. En consecuencia, se identificó un punto situado unos 50 metros más arriba de Q1.2M (Q2.1U) que representa plenamente la descarga en este lugar durante la temporada húmeda, y se ha identificado un punto más abajo (Q2.1L2) que representa plenamente la descarga en este lugar durante la temporada seca.
El acceso a todos los sitios se realiza por la ribera derecha del río, por un camino accidentado que atraviesa y pasa más allá de la Hacienda San José de Toyas. El camino termina unos 500 m más allá de la hacienda, entre vegetación arbustiva, aunque después de junio de 2023 gran parte de la vegetación de la ribera derecha fue despejada y convertida en tierras de cultivo. Un sendero conduce desde el camino a través de los campos hacia la izquierda hasta Q2.1U y hacia la derecha hasta una puerta que da acceso al bosque por el que discurre el río para llegar a Q2.1L2.
Data analysis
The discharge initially recorded at this site probably only reflects the discharge in sub-channels that exist when the main channel is full and overflows. The channel becomes very braided as it approaches the river Cachi so care needs to be taken to identify the main channel.
A new wet season main channel site (Q2.1U) has been identified and a new dry season site (Q2.1L2) so that the discharge figures since February 2025 and November 2025 respectively are likely to be more accurate. However, the discharge recorded at this site is often lower than at sites higher up the valley. This is probably because it is significantly impacted by water extraction for irrigation higher up the valley, often leaving the channel completely dry. Consequently, much of the water at this site must originate either from irrigation water returning to the channel or manantials - there are a couple of significant manantials upstream of the site - below site Q2.2.
In the rainy season months the pH, conductivity and alkalinity were all lower than in the dry season months. In February 2025 (wet season) the lowest pH, conductivity and alkalinity data was recorded while in June and November 2025 (dry season) the figures were some of the highest recorded. This suggests significant dilution in the rainy season and the importance of not abstrating too much water from the channel and maintaining the natural flow all year round.
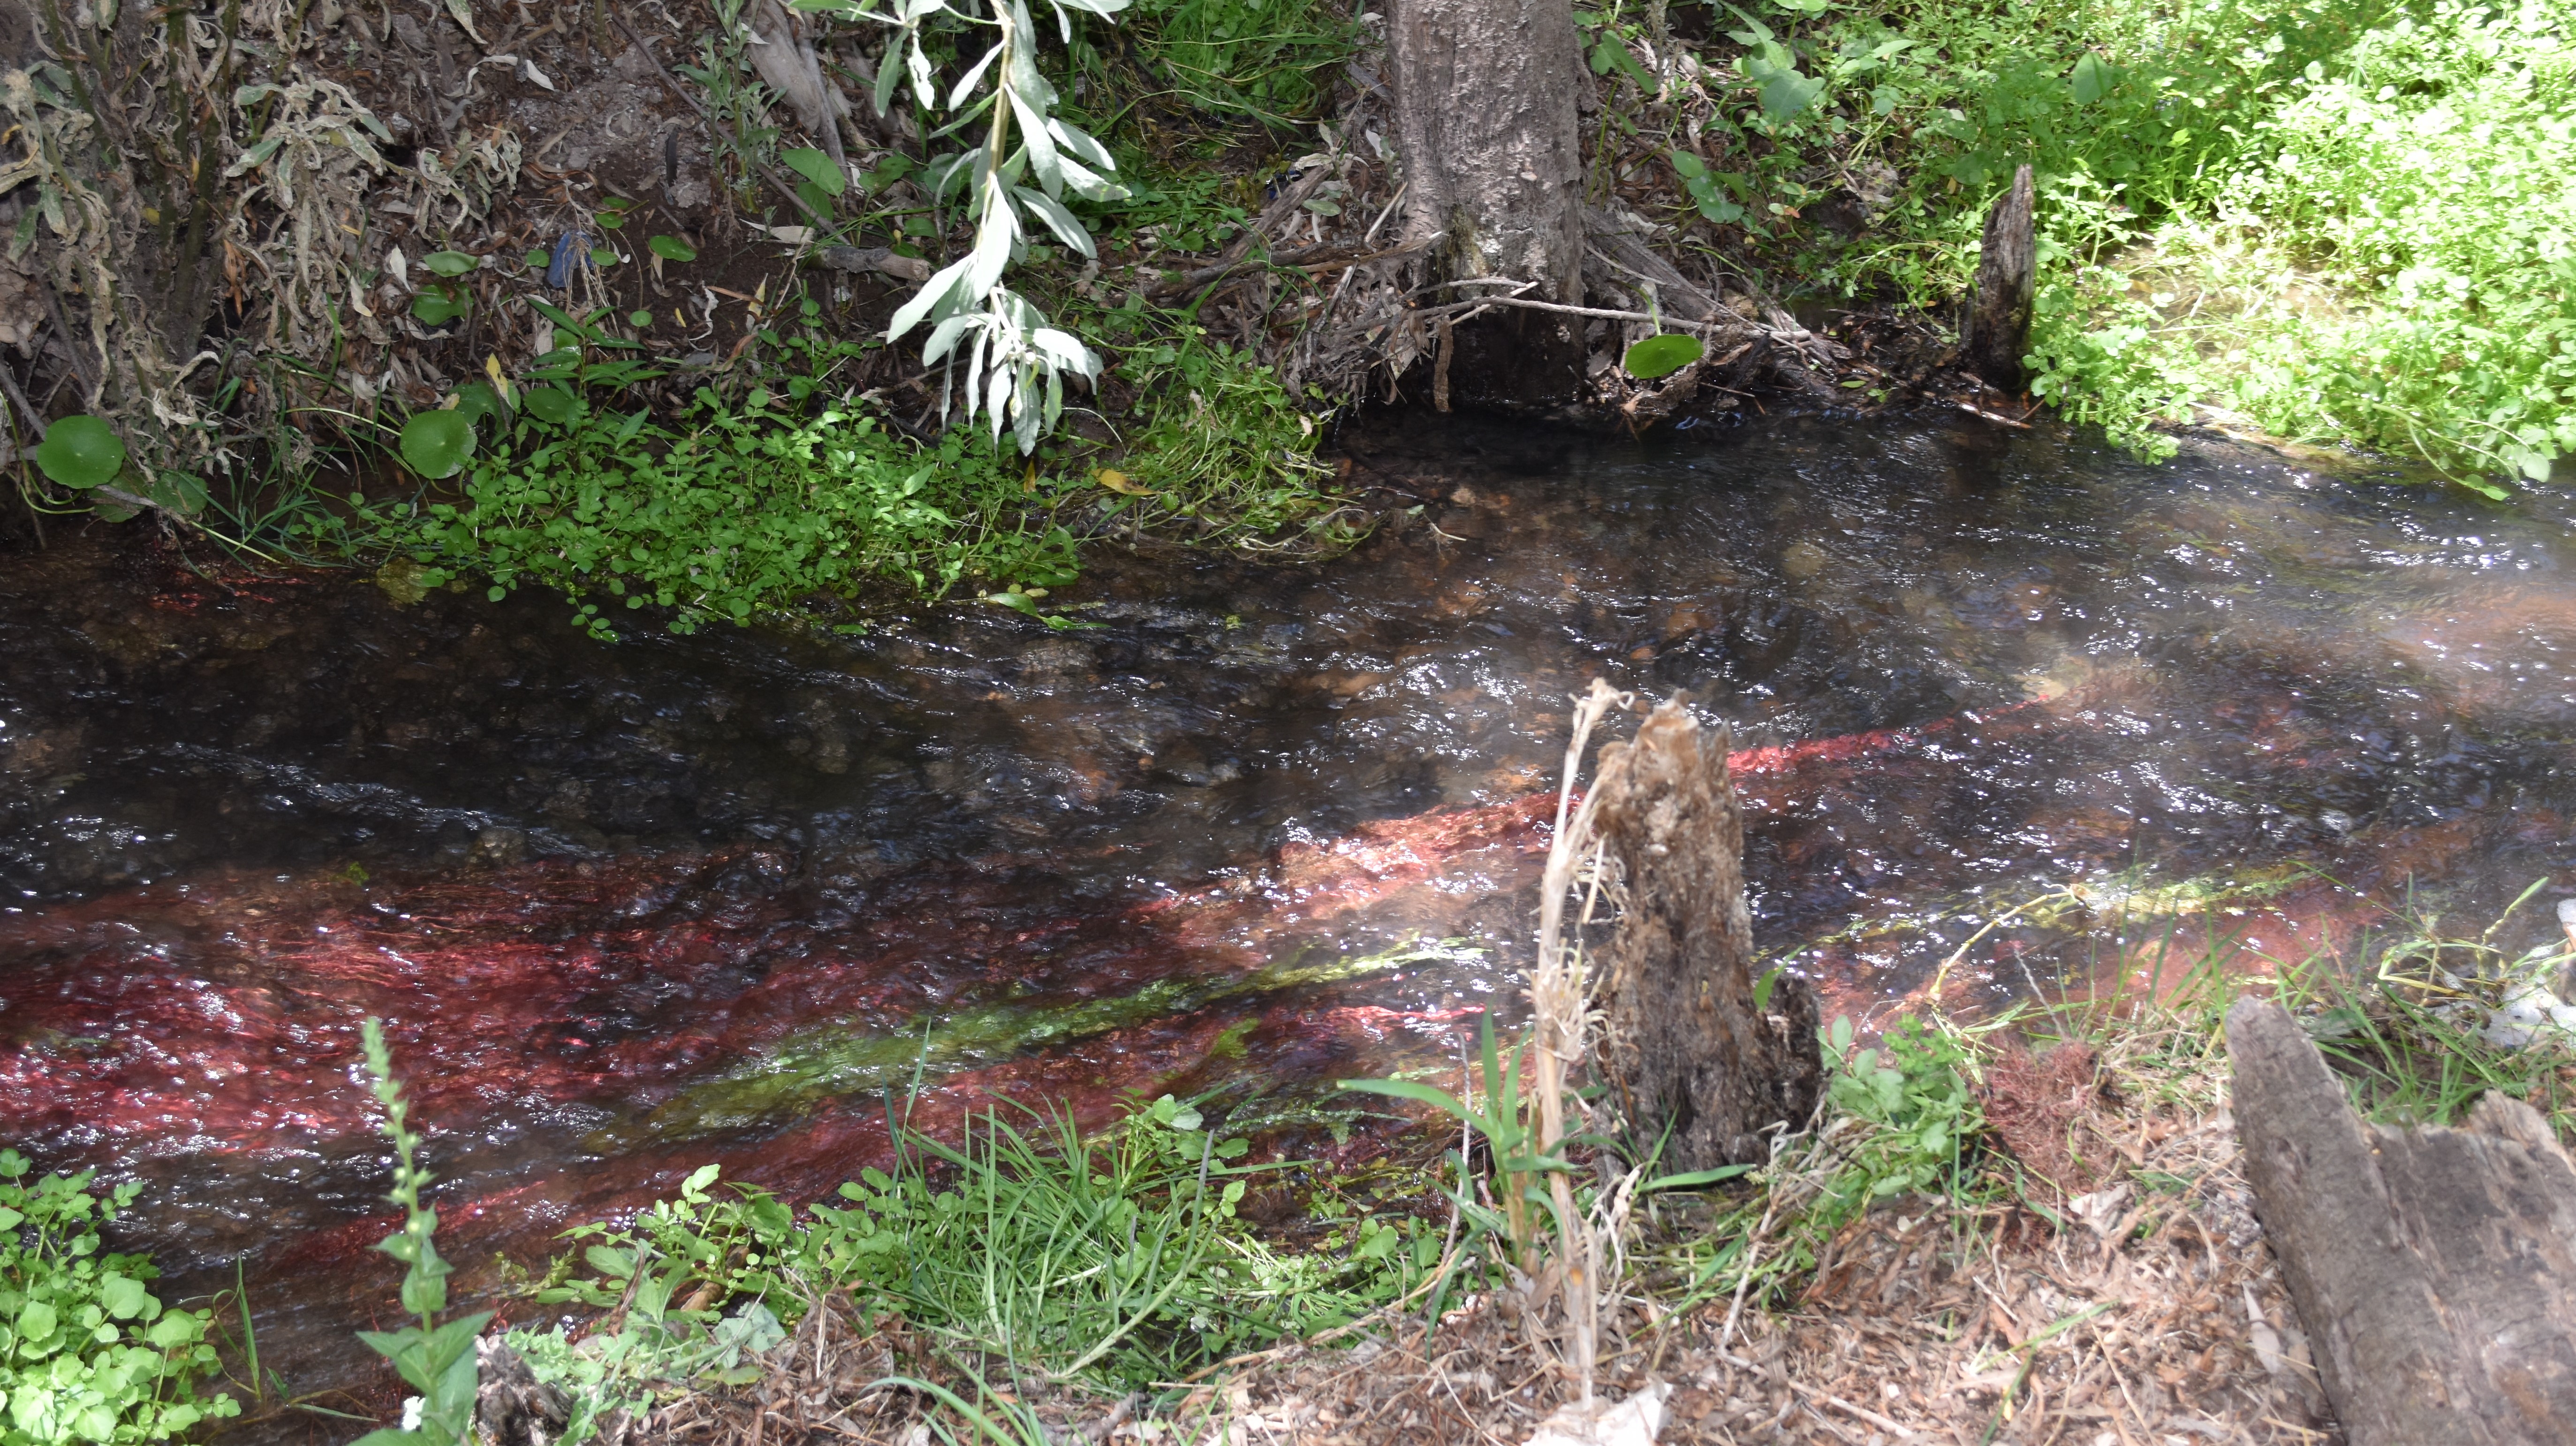
There is evidence of contamination at this site. However, the extact origin of the contaminants requires further investigation, in particular the imapct of the Huanta urban area and nearby manantiales.
Análisis de datos
La descarga registrada inicialmente en este sitio probablemente solo refleje la descarga en los subcanales que existen cuando el canal principal está lleno y se desborda. El canal se vuelve muy ramificado a medida que se acerca al río Cachi, por lo que hay que tener cuidado para identificar el canal principal.
Se ha identificado un nuevo emplazamiento del canal principal para la temporada húmeda (Q2.1U) y un nuevo emplazamiento para la temporada seca (Q2.1L2), por lo que es probable que las cifras de descarga desde febrero de 2025 y noviembre de 2025, respectivamente, sean más precisas. Sin embargo, la descarga registrada en este lugar suele ser inferior a la de otros lugares situados más arriba en el valle. Probablemente esto se deba a que se ve significativamente afectada por la extracción de agua para el riego en la parte alta del valle, lo que a menudo deja el canal completamente seco. Por consiguiente, gran parte del agua de este emplazamiento debe proceder del agua de riego que vuelve al cauce o de manantiales —hay un par de pequeños manantiales aguas arriba del emplazamiento— situados por debajo del emplazamiento Q2.2.
En los meses de la temporada lluviosa, el pH, la conductividad y la alcalinidad fueron más bajos que en los meses de la temporada seca. En febrero de 2025 (temporada de lluvias) se registraron los datos más bajos de pH, conductividad y alcalinidad, mientras que en junio y noviembre de 2025 (temporada seca) las cifras fueron algunas de las más altas registradas. Esto sugiere una dilución significativa en la temporada lluviosa y la importancia de no extraer demasiada agua del canal y mantener el flujo natural durante todo el año. Sin embargo, el origen exacto de los contaminantes en el río en este lugar requiere una investigación más profunda.
Hay indicios de contaminación en este sitio. Sin embargo, es necesario seguir investigando el origen exacto de los contaminantes, en particular el impacto de la zona urbana de Huanta y de los manantiales cercanos.
River & water quality data / Datos fluviales y de calidad del agua
The following river and water quality data was collected from this site:
En este lugar se recogieron los siguientes datos fluviales y de calidad del agua:
| Site / Sitio: Q2.1 | Q2.1M - March / marzo 2023 | Q2.1M - June / junio 2023 | Q2.1L1 - Nov. / nov. 2023 | Q2.1L1 - March / marzo 2024 | Q2.1L1 - June / junio 2024 | Q2.1L1 - Nov. / nov. 2024 | Q2.1U - February / febrero 2025 | Q2.1U - June / junio 2025 | Q2.1L2 - Nov. / nov. 2025 | Q2.1U - March / marzo 2026 |
|---|---|---|---|---|---|---|---|---|---|---|
| Season / Temporada: | Austral Summer / Verano | Austral Winter / Invierno | Austral Winter / Invierno | Austral Summer / Verano | Austral Winter / Invierno | Austral Winter / Invierno | Austral Summer / Verano | Austral Winter / Invierno | Austral Winter / Invierno | Austral Summer / Verano |
| Date / Fecha: | 17.3.23 | 19.6.23 | 21.11.23 | 27.3.24 | 26.6.24 | 26.11.24 | 25.2.25 | 1.7.25 | 2.12.25 | 20.3.26 |
| Time / Hora: | 7.30 | 9.00 | 9.30 | 11.30 | 9.30 | 10.00 | 9.45 | 9.30 | 9.45 | 10.00 |
| Width / Ancho (m) | 3.09 | 2.38 | 1.25 | 1.50 | 1.00 | 1.10 | 4.10 | 4.20 | 1.68 | 4.50 |
| Depth / Profundidad (Av.) (m) | 0.16 | 0.21 | 0.09 | 0.09 | 0.05 | 0.18 | 0.30 | 0.15 | 0.10 | 0.30 |
| CSA / Area traversal (Av.) (m²) | 0.49 | 0.50 | 0.113 | 0.135 | 0.050 | 0.198 | 1.320 | 0.630 | 0.168 | 1.350 |
| Velocity / Velocidad (Av.) (m/s) | 0.42 | 0.450 | 0.427 | 0.685 | 0.261 | 0.971 | 1.122 | 0.277 | 0.634 | 1.046 |
| Discharge / Caudal (Av.) (m³/s) | 0.208 | 0.225 | 0.048 | 0.092 | 0.013 | 0.192 | 1.481 | 0.175 | 0.107 | 1.412 |
| Riverbed sediment / Sedimentos | Mainly pebbles / Mas piedritas | Cobbles & Pebbles / Piedras y Piedritas | Mainly pebbles / Mas piedritas | Mainly pebbles / Mas piedritas | Mainly pebbles & sand / Mas piedritas y arena | Mainly pebbles & sand / Mas piedritas y arena | Mainly sand / Mas arena | A mix / Una mezcla | Cobbles & Pebbles / Piedras y Piedritas | Cobbles & Pebbles / Piedras y Piedritas |
| Temperature (Atmospheric) (°C) | 20.3 | 20.9 | 24.4 | 19.5 | 15.6 | 19.7 | 16.9 | 18.2 | 20.00 | 18.1 |
| Temperature (Water / Agua) (°C) | 17.92 | 14.95 | 18.99 | 15.86 | 15.28 | 18.19 | 14.4 | 16.31 | 18.28 | 15.01 |
| Atmospheric pressure / presión (mbar) | 804.1 | 807.3 | 803.6 | 795.9 | 797.2 | 806.4 | 805.3 | 795.7 | 793.4 | 802.0 |
| Dissolved oxygen / Oxigeno disuelto (ppm) (MP)* | 9.39 | 5.47 | 3.36 | 3.88 | 4.07 | 5.03 | 4.55 | 3.40 | 10.74 | |
| Dissolved oxygen / Oxigeno disuelto (%) (MP)* | 113.3 | 72.3 | 41.8 | 47.0 | 68.8 | 77.3 | 76.1 | 44.9 | 132.6 | |
| pH | 8.38 | 8.36 | 8.41 | 7.87 | 8.05 | 8.54 | 7.86 | 8.34 | 8.58 | 8.38 |
| Conductivity / Conductividad (µS/cm) | 847 | 874 | 923 | 409 | 835 | 1007 | 246 | 1701 | 864 | 360 |
| Total Dissolved Solids (TDS / SDT) (ppm) | 424 | 437 | 462 | 205 | 418 | 504 | 124 | 851 | 432 | 180 |
| ORP (mV) | 223.8 | 80.8 | 5.9 | -26.0 | -57.3 | -45.9 | 79.6 | 96.6 | 26.3 | 213.7 |
| Turbidity / Turbidez | Grey/Brown - Gris/Marron | Clear / Transparente | Clear / Transparente | Light Brown / Marron ligero | Clear / Transparente | Clear: slightly grey / Transparente: un poco gris | Turbid: Light Brown / Turbidez; Marron ligero | Clear: slightly grey / Transparente: un poco gris | Clear / Transparente | Light Brown / Marron ligero |
| Alkalinity/Alkalinidad (Titración) (ppm CaCO₃)** | 320 | 323 | 350 | 158 | 362 | 368 | 84 | 361 | 370 | 129 |
| Alkalinity Field Tester (Hanna) (ppm CaCO₃) | 286 | 382 | 272 | 125 | 337 | 343 | 69 | 367 | 359 | 106 |
| *Also refer to MT DO results post-2023 / Consulte también los resultados de MT DO posteriores a 2023. | ** 1.6N |