Q3.1 - Lower Chihua (Huamanguilla-Iguian) - Cangari / Chihua Baja (Huamanguilla-Iguian) - Cangari
Site Q3.1 - Lower Chihua (Huamanguilla-Iguian) - Cangari / Chihua Baja (Huamanguilla-Iguian) - Cangari
GPS: S12°983733, W74°292386. Elevation: 2310m asl.
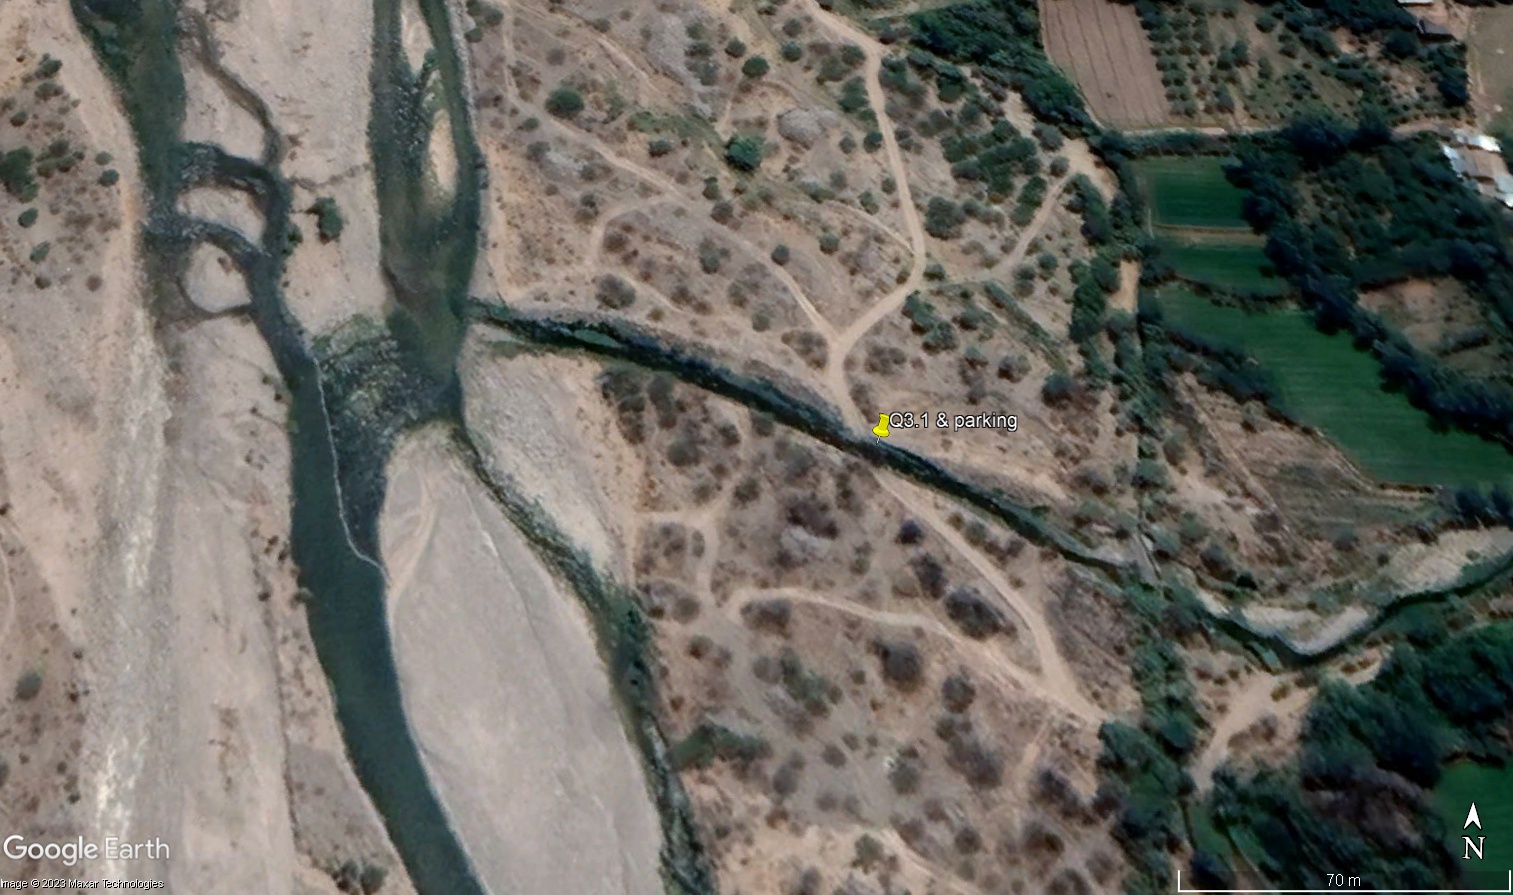
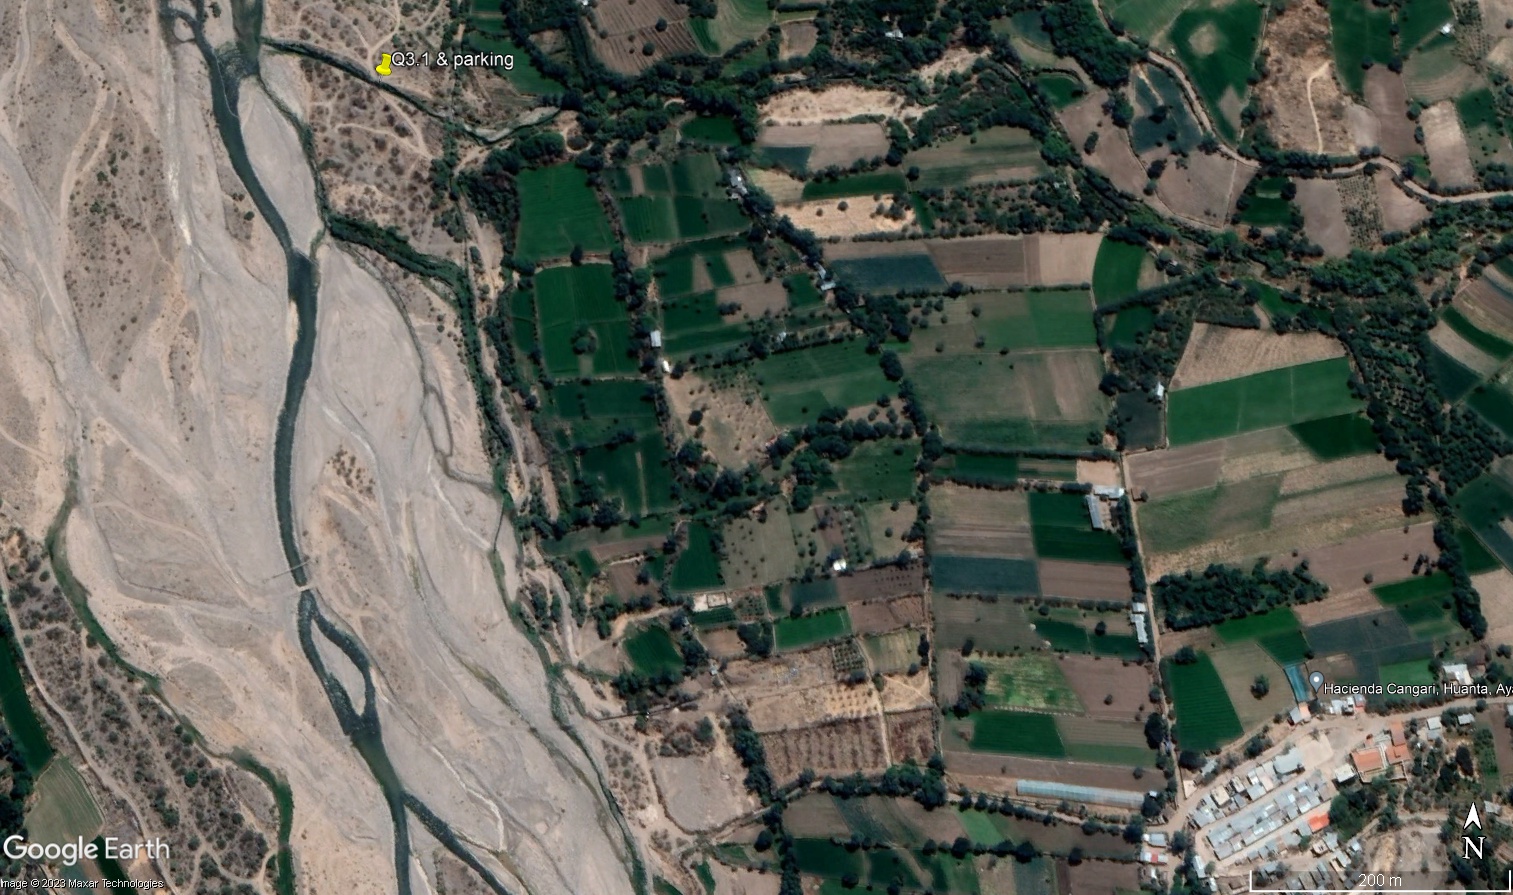 Aerial view of study site / Vista aérea del lugar del estudio (March 2023) (John Forrest)
 The study site / El lugar del estudio (March 2023) (John Forrest)
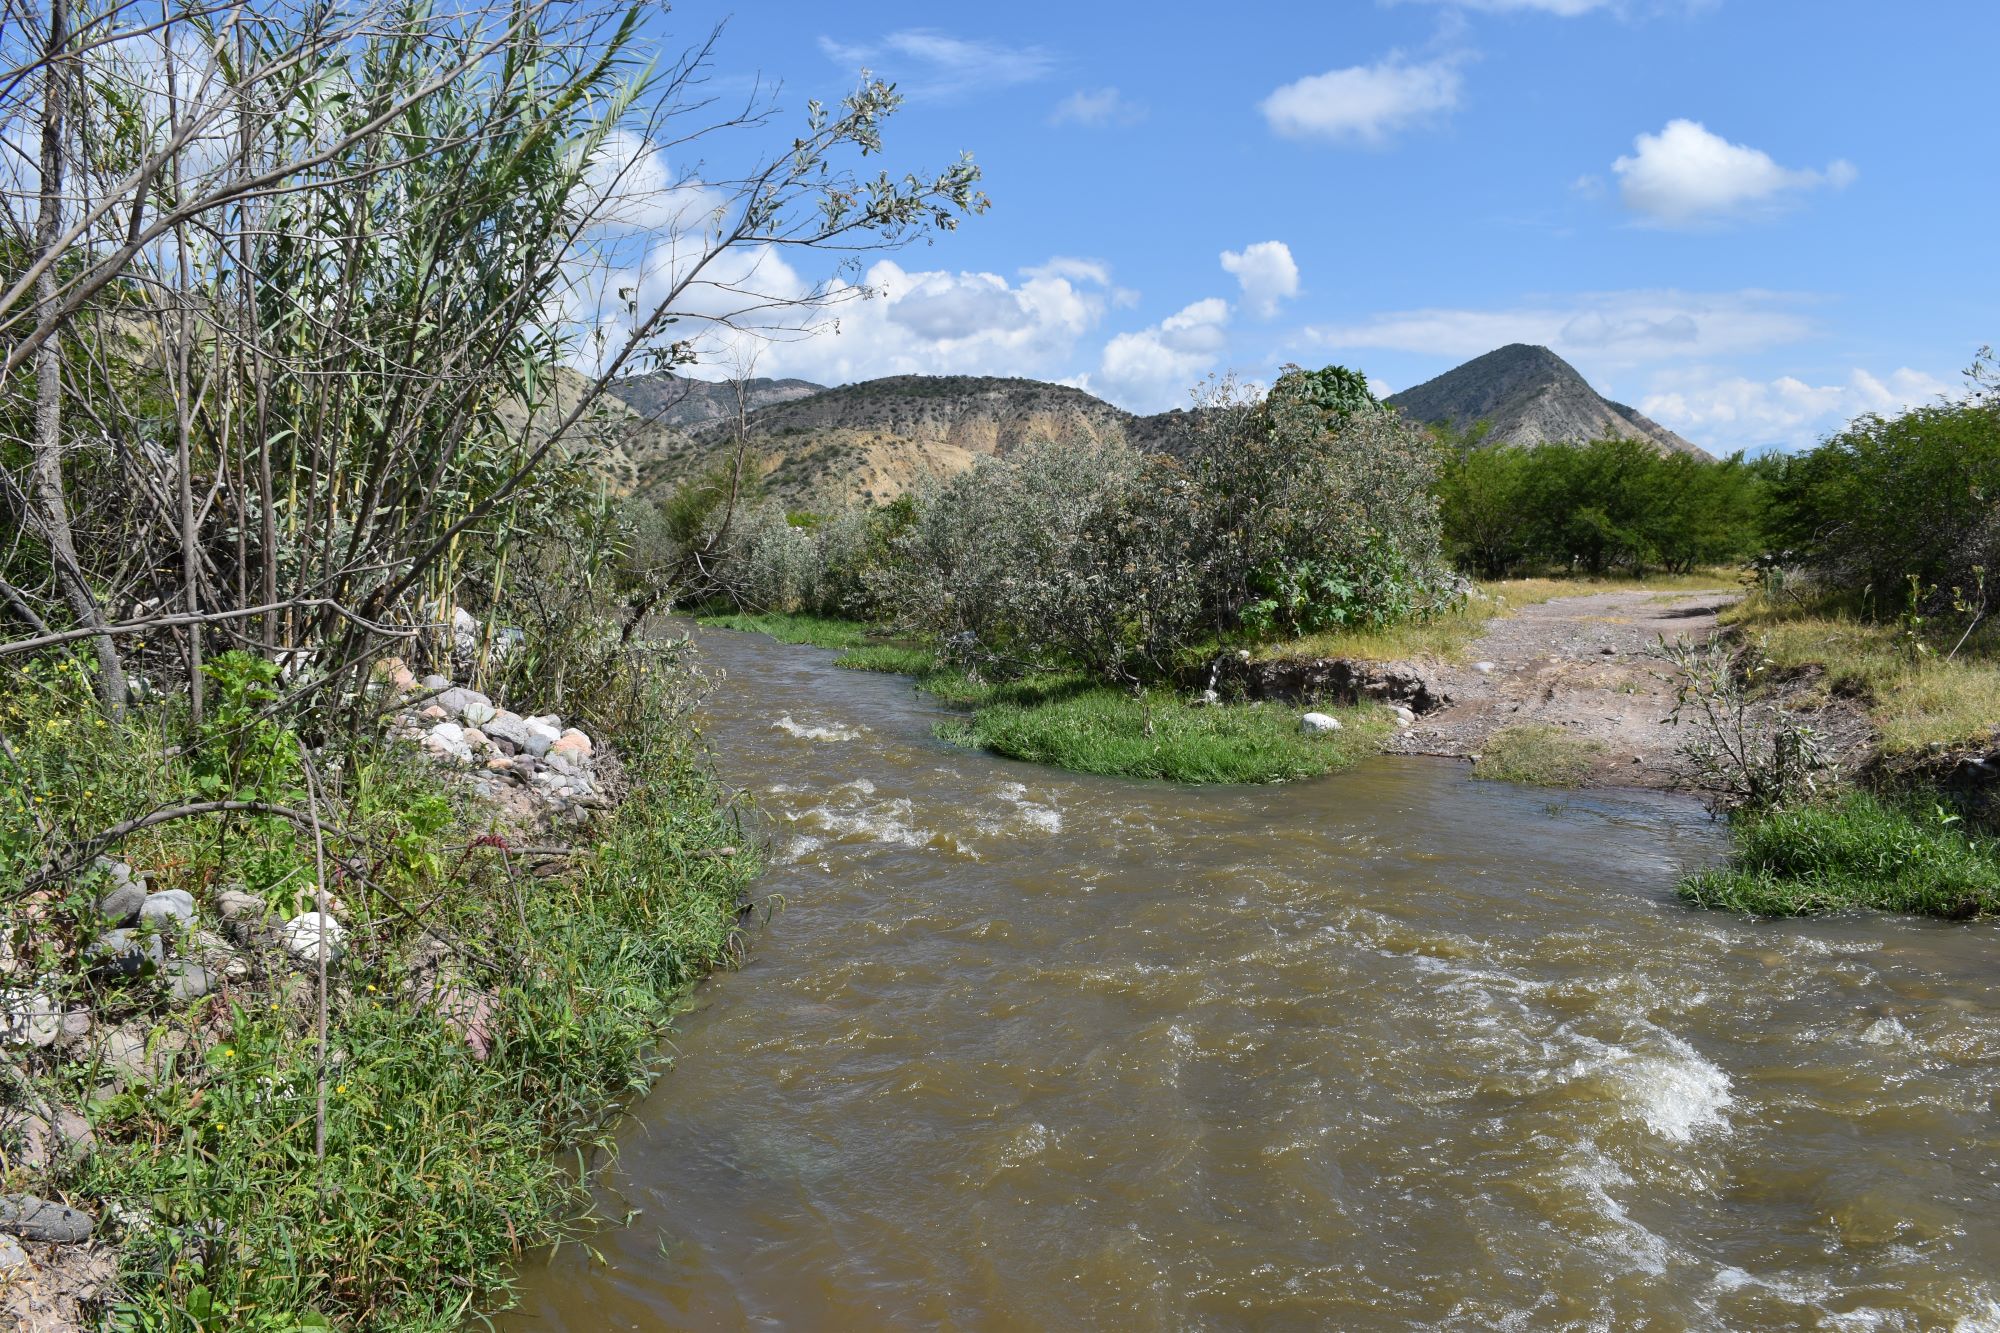 View downstream from the study site / Visita rio abajo del lugar del estudio (March 2023) (John Forrest)
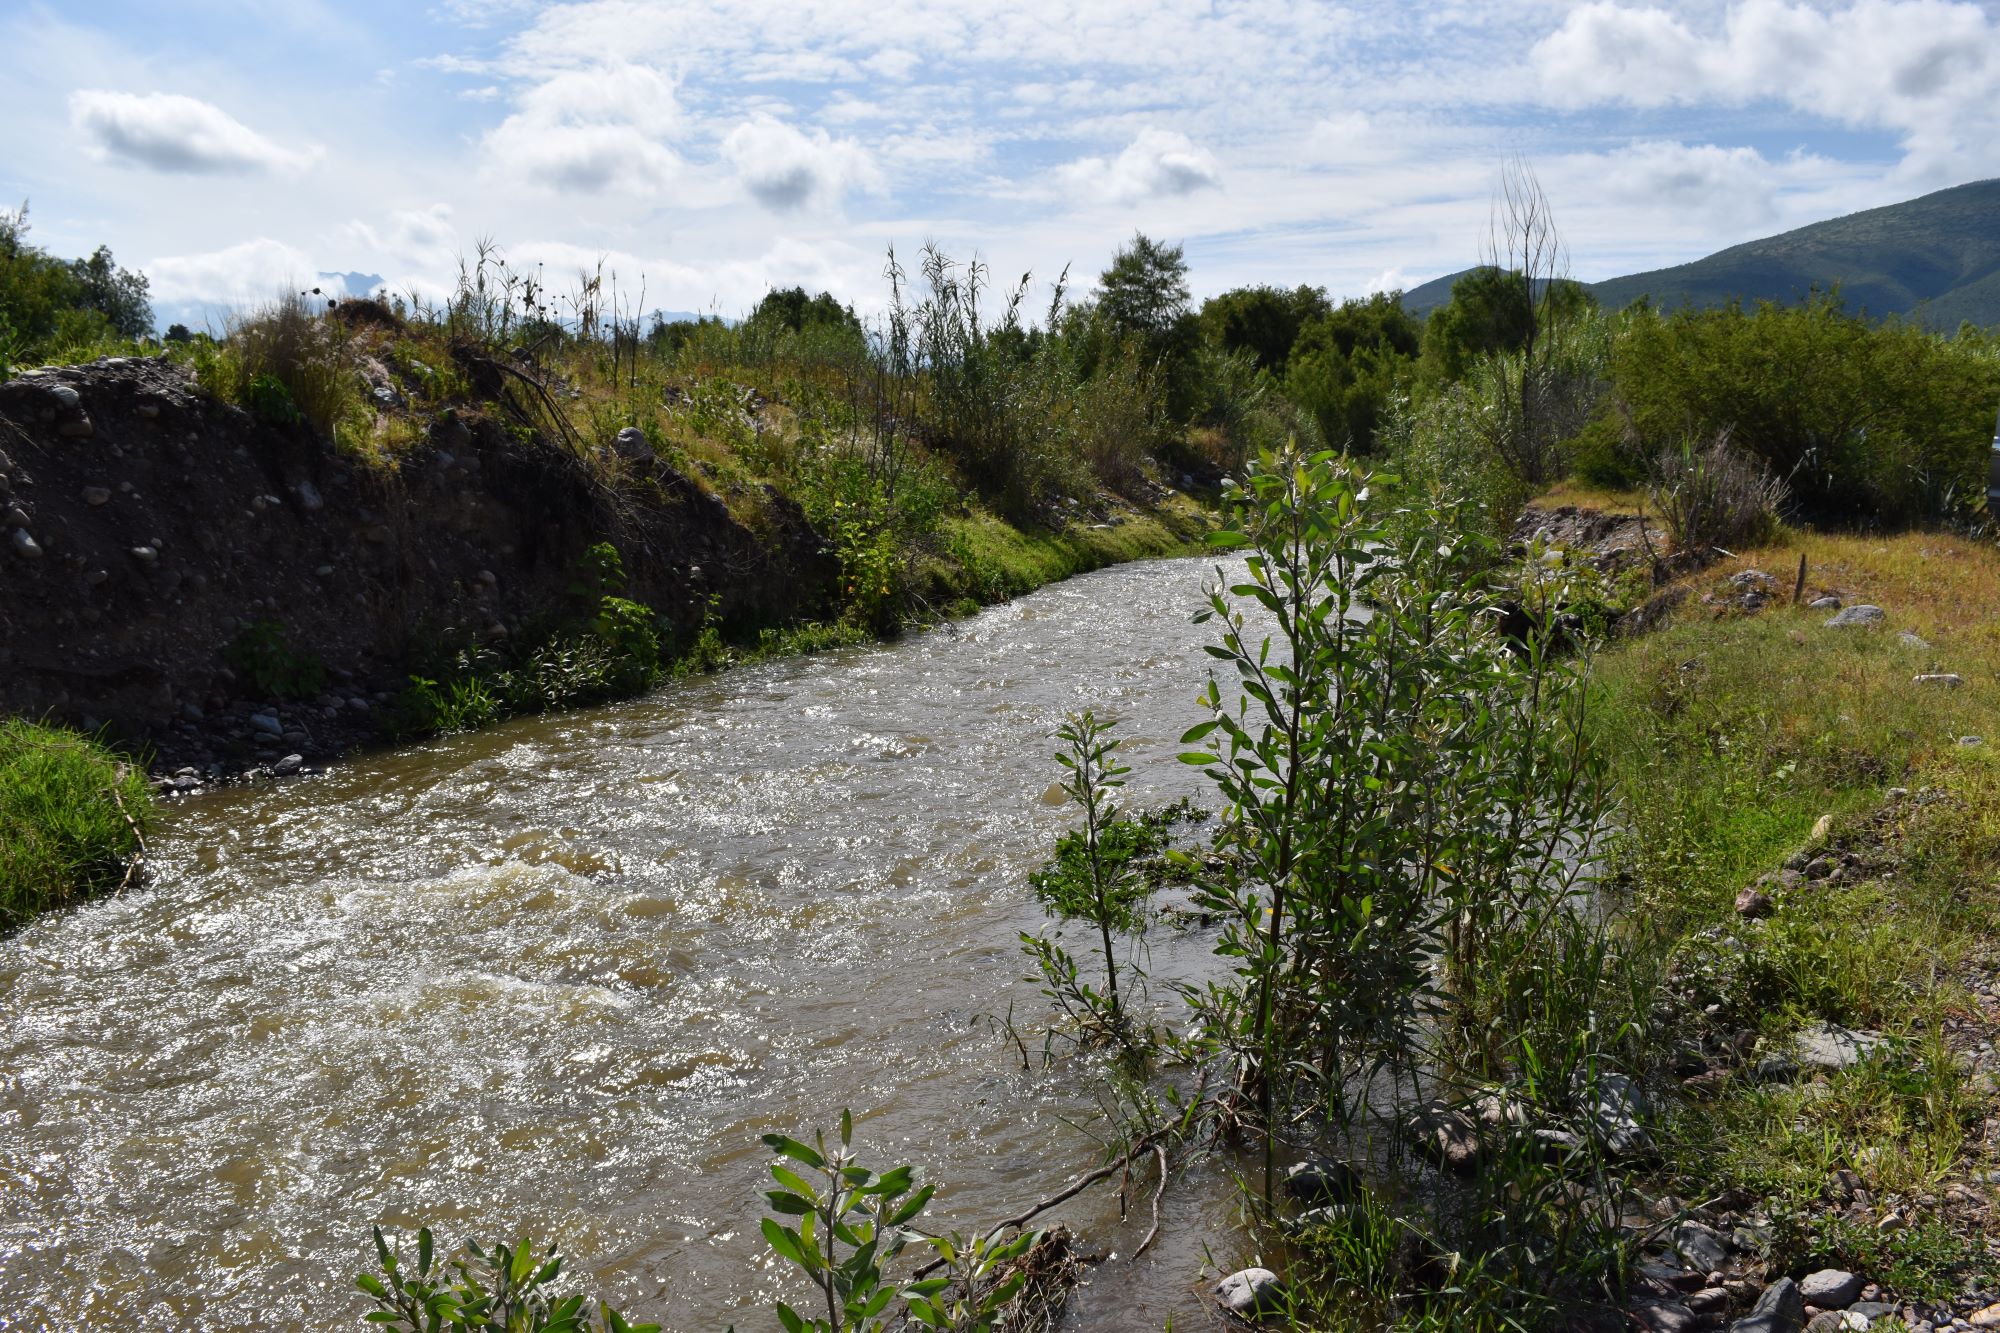 View upstream from the study site / Vista rio arriba desde el lugar del estudio (March 2023) (John Forrest)
Site description
Q3.1 is located in a wide valley with a clear flood-plain cutting through the foothills lining the eastern flank of the Cachi valley, below Huanta.
The study site is situated where a rough track fords the river Chihua (Huamanguilla-Iguian) about 50 metres upstream from its confluence with the river Cachi. The measurements are best taken at this point and even if the river level is high, vehicles can provide access to both banks of the river.
Access is beyond the settlement of Cangari. A track runs for 300 metres down to the river Cachi and then follows the right bank downstream for about 750 metres before dividing - take the track to the left for a further 100 metres to reach the site.
Descripción del sitio
Q3.1 se encuentra en un amplio valle con una clara llanura de inundación que atraviesa las estribaciones que bordean el flanco oriental del valle de Cachi, debajo de Huanta.
El sitio de estudio está situado donde un camino accidentado vadea el río Chihua (Huamanguilla-Iguian) a unos 50 metros aguas arriba de su confluencia con el Río Cachi. Las mediciones se realizan mejor en este punto e incluso si el nivel del río es alto, los vehículos pueden proporcionar acceso a ambos orillas del rio.
El acceso se encuentra más allá del pueblito de Cangari. Una trocha desciende 300 metros hasta el río Cachi y luego sigue la orilla derecha río abajo durante unos 750 metros antes de dividirse: tome la trocha de la izquierda durante otros 100 metros para llegar al lugar.
Data Analysis
The river Chihua flows all year round and is the only major tributary close to Huanta to do so. This suggests that it has a closer correlation with rainfall levels than the other tributaries and that less water is extracted from it for urban and irrigation purposes. However, the discharge figures, even in the rainy season, are relatively low.
The highest discharge has been recorded in February/March, the wet season, with the highest figure recorded in February 2025. In 2023, a very dry year, the lowest discharge was recorded in November prior to the arrival of the new rainy season, however, in 2024, a wetter year, the discharge was higher in November than June as the rains had already returned.
NB.Discharge from the main Huanta sewage plant (PTAR) enters the river a short distance upstream from Q3.1 and at certain times throughout the year, potentially more so in the rainy season, may raise discharge levels at the lowest site.
NB.The river Chihua receives discharge from five sewage plants (PTARs) within its catchment. Only the main Huanta plant is of any size while the other much smaller plants are all much higher up in the catchment.
The higher discharge appears to coincide with lower pH, the lowest was recorded in February 2025 when discharge was the highest recorded; lower conductivity, the lowest figure was recorded in March 2023; and lower alkalinity, lowest in February 2025. The higher discharge is likely to dilute the contamination entering the river from the large sewage plant. When discharge is very low, the pH, conductivity and alkalinity are all much higher. Overall, the data for many parameters is quite variable at this site which again may reflect the variable input from the PTARs.
Análisis de datos
El río Chihua fluye durante todo el año y es el único afluente importante cercano a Huanta que lo hace. Esto sugiere que tiene una correlación más estrecha con los niveles de precipitación que los demás afluentes y que se extrae menos agua de él para uso urbano y de riego. Sin embargo, los caudales, incluso en la temporada de lluvias, son relativamente bajos.
El mayor caudal se ha registrado en febrero/marzo, la estación lluviosa, alcanzando su valor máximo en febrero de 2025. En 2023, un año muy seco, el menor caudal se registró en noviembre, antes de la llegada de la nueva estación lluviosa; sin embargo, en 2024, un año más lluvioso, el caudal fue mayor en noviembre que en junio, ya que las lluvias habían regresado.
Nota: El caudal del PTAR principal de Huanta desemboca en el río a poca distancia aguas arriba del punto Q3.1 y, en determinadas épocas del año, especialmente durante la temporada de lluvias, puede elevar el caudal en el punto más bajo.
Nota: El río Chihua recibe aguas residuales de cinco PTARs dentro de su cuenca. Solo el PTAR de Huanta tiene una capacidad considerable; las demás, mucho más pequeñas, se encuentran rios arriba en la cuenca.
El mayor caudal del rio parece coincidir con un pH más bajo (el valor más bajo se registró en febrero de 2025, cuando el caudal fue el más alto registrado), una conductividad más baja (el valor más bajo se registró en marzo de 2023) y una alcalinidad más baja (el valor más bajo se registró en febrero de 2025). Es probable que el mayor caudal diluya la contaminación que llega al río desde la gran planta de tratamiento de aguas residuales. Cuando el caudal es muy bajo, el pH, la conductividad y la alcalinidad son mucho más altos. En general, los datos de muchos parámetros son bastante variables en este sitio, lo que nuevamente puede reflejar la variabilidad de los aportes de los PTAR.
River & water quality data / Datos fluviales y de calidad del agua
The following river and water quality data was collected from this site:
En este lugar se recogieron los siguientes datos fluviales y de calidad del agua:
| Site / Sitio: Q3.1 | March / marzo 2023 | June / junio 2023 | Nov. / nov. 2023 | March / marzo 2024 | June / junio 2024 | Nov. / nov. 2024 | February / febrero 2025 | June / junio 2025 | Nov. / nov. 2025 | March / marzo 2026 |
|---|---|---|---|---|---|---|---|---|---|---|
| Season / Temporada: | Austral Summer / Verano | Austral Winter / Invierno | Austral Winter / Invierno | Austral Summer / Verano | Austral Winter / Invierno | Austral Winter / Invierno | Austral Summer / Verano | Austral Winter / Invierno | Austral Winter / Invierno | Austral Summer / Verano |
| Date / Fecha: | 20.3.23 | 20.6.23 | 23.11.23 | 20.3.24 | 23.6.24 | 24.11.24 | 21.2.25 | 27.6.25 | 28.11.25 | 18.3.26 |
| Time / Hora: | 8.30 | 9.45 | 11.00 | 12.00 | 8.30 | 9.30 | 9.00 | 8.30 | 8.30 | 9.00 |
| Width / Ancho (m) | 10.20 | 8.40 | 1.82 | 5.40 | 9.34 | 4.10 | 12.40 | 4.55 | 9.10 | 10.86 |
| Depth / Profundidad (Av.) (m) | 0.22 | 0.07 | 0.103 | 0.37 | 0.07 | 0.21 | 0.34 | 0.13 | 0.11 | 0.33 |
| CSA / Area traversal (Av.) (m²) | 2.240 | 0.590 | 0.188 | 2.000 | 0.654 | 0.861 | 4.216 | 0.592 | 1.001 | 3.584 |
| Velocity / Velocidad (Av.) (m/s) | 0.78 | 0.250 | 0.127 | 0.860 | 0.307 | 0.394 | 0.913 | 0.178 | 0.395 | 0.862 |
| Discharge / Caudal (Av.) (m³/s) | 1.741 | 0.147 | 0.024 | 1.720 | 0.201 | 0.339 | 3.849 | 0.105 | 0.395 | 3.089 |
| Riverbed sediment / Sedimentos | Mainly pebbles / Mas piedritas | Cobbles & Pebbles / Piedras y Piedritas | Sand & Pebbles / Arena y Piedritas | Cobbles & Pebbles / Piedras y Piedritas | Sand & Pebbles / Arena y Piedritas | Sand & Pebbles / Arena y Piedritas | Cobbles & Pebbles / Piedras y Piedritas | Boulderss & Cobbles / Rocas y Piedras | Mainly rocks & pebbles / Mas rocas y piedritas | Mainly sand & Pebbles / Mas Arena y Piedritas |
| Temperature (Atmospheric) (°C) | 21.6 | 28.0 | 20.8 | 26.7 | 17.3 | 20.3 | 20.3 | 21.1 | 25.2 | 22.5 |
| Temperature (Water / Agua) (°C) | 14.77 | 16.01 | 19.02 | 17.76 | 14.44 | 18.26 | 14.22 | 15.63 | 19.05 | 13.73 |
| Atmospheric pressure / presión (mbar) | 809.2 | 808.3 | 764.6 | 803.0 | 794.6 | 803.6 | 803.8 | 802.1 | 794.6 | 802.7 |
| Dissolved oxygen / Oxigeno disuelto (ppm)(MP)* | 6.88 | 6.73 | 6.97 | 3.40 | 4.22 | 3.77 | 4.92 | 4.06 | 3.02 | 11.51 |
| Dissolved oxygen / Oxigeno disuelto (%)(MP)* | 82.2 | 82.6 | 102.2 | 57.1 | 50.9 | 63.9 | 76.2 | 65.7 | 39.3 | 134.4 |
| pH | 7.98 | 8.07 | 8.71 | 8.16 | 8.13 | 8.45 | 7.30 | 8.30 | 8.07 | 8.18 |
| Conductivity / Conductividad (µS/cm) | 171 | 795 | 196 | 174 | 754 | 511 | 188 | 1697 | 1003 | 204 |
| Total Dissolved Solids (TDS / SDT) (ppm) | 86 | 397 | 98 | 87 | 377 | 255 | 94 | 848 | 501 | 101 |
| ORP (mV) | 248.8 | 157.2 | 152.9 | 112.1 | 74.1 | 56.6 | 124.1 | 44.8 | 77.3 | 191.7 |
| Turbidity / Turbidez | Clear: slightly green Claro: poco verde | Turbid: Green / Turbidez: Verde | Clear / Transparente | Turbid: beige/green / Turbidez: marron/verde | Very Turbid: green / Mucho turbidez: verde | Turbid: green/ brown / Turbidez: verde/marron | Turbid: slightly brown / Turbidez: poco marron | Turbid: grey/green / Turbidez: gris/verde | Turbid: green / Turbidez: verde | Turbid: beige / Turbidez: marron ligero |
| Alkalinity/Alkalinidad (Titración)(ppm CaCO₃)** | 81 | 255 | 350 | 110 | 244 | 173 | 71 | 260 | 305 | 81 |
| Alkalinity Field Tester (Hanna) (ppm CaCO₃) | 80 | 223 | 314 | 55 | 220 | 158 | 51 | 288 | 339 | 67 |
| *Also refer to MT DO results post-2023 / Consulte también los resultados de MT DO posteriores a 2023. | ** 1.6N |